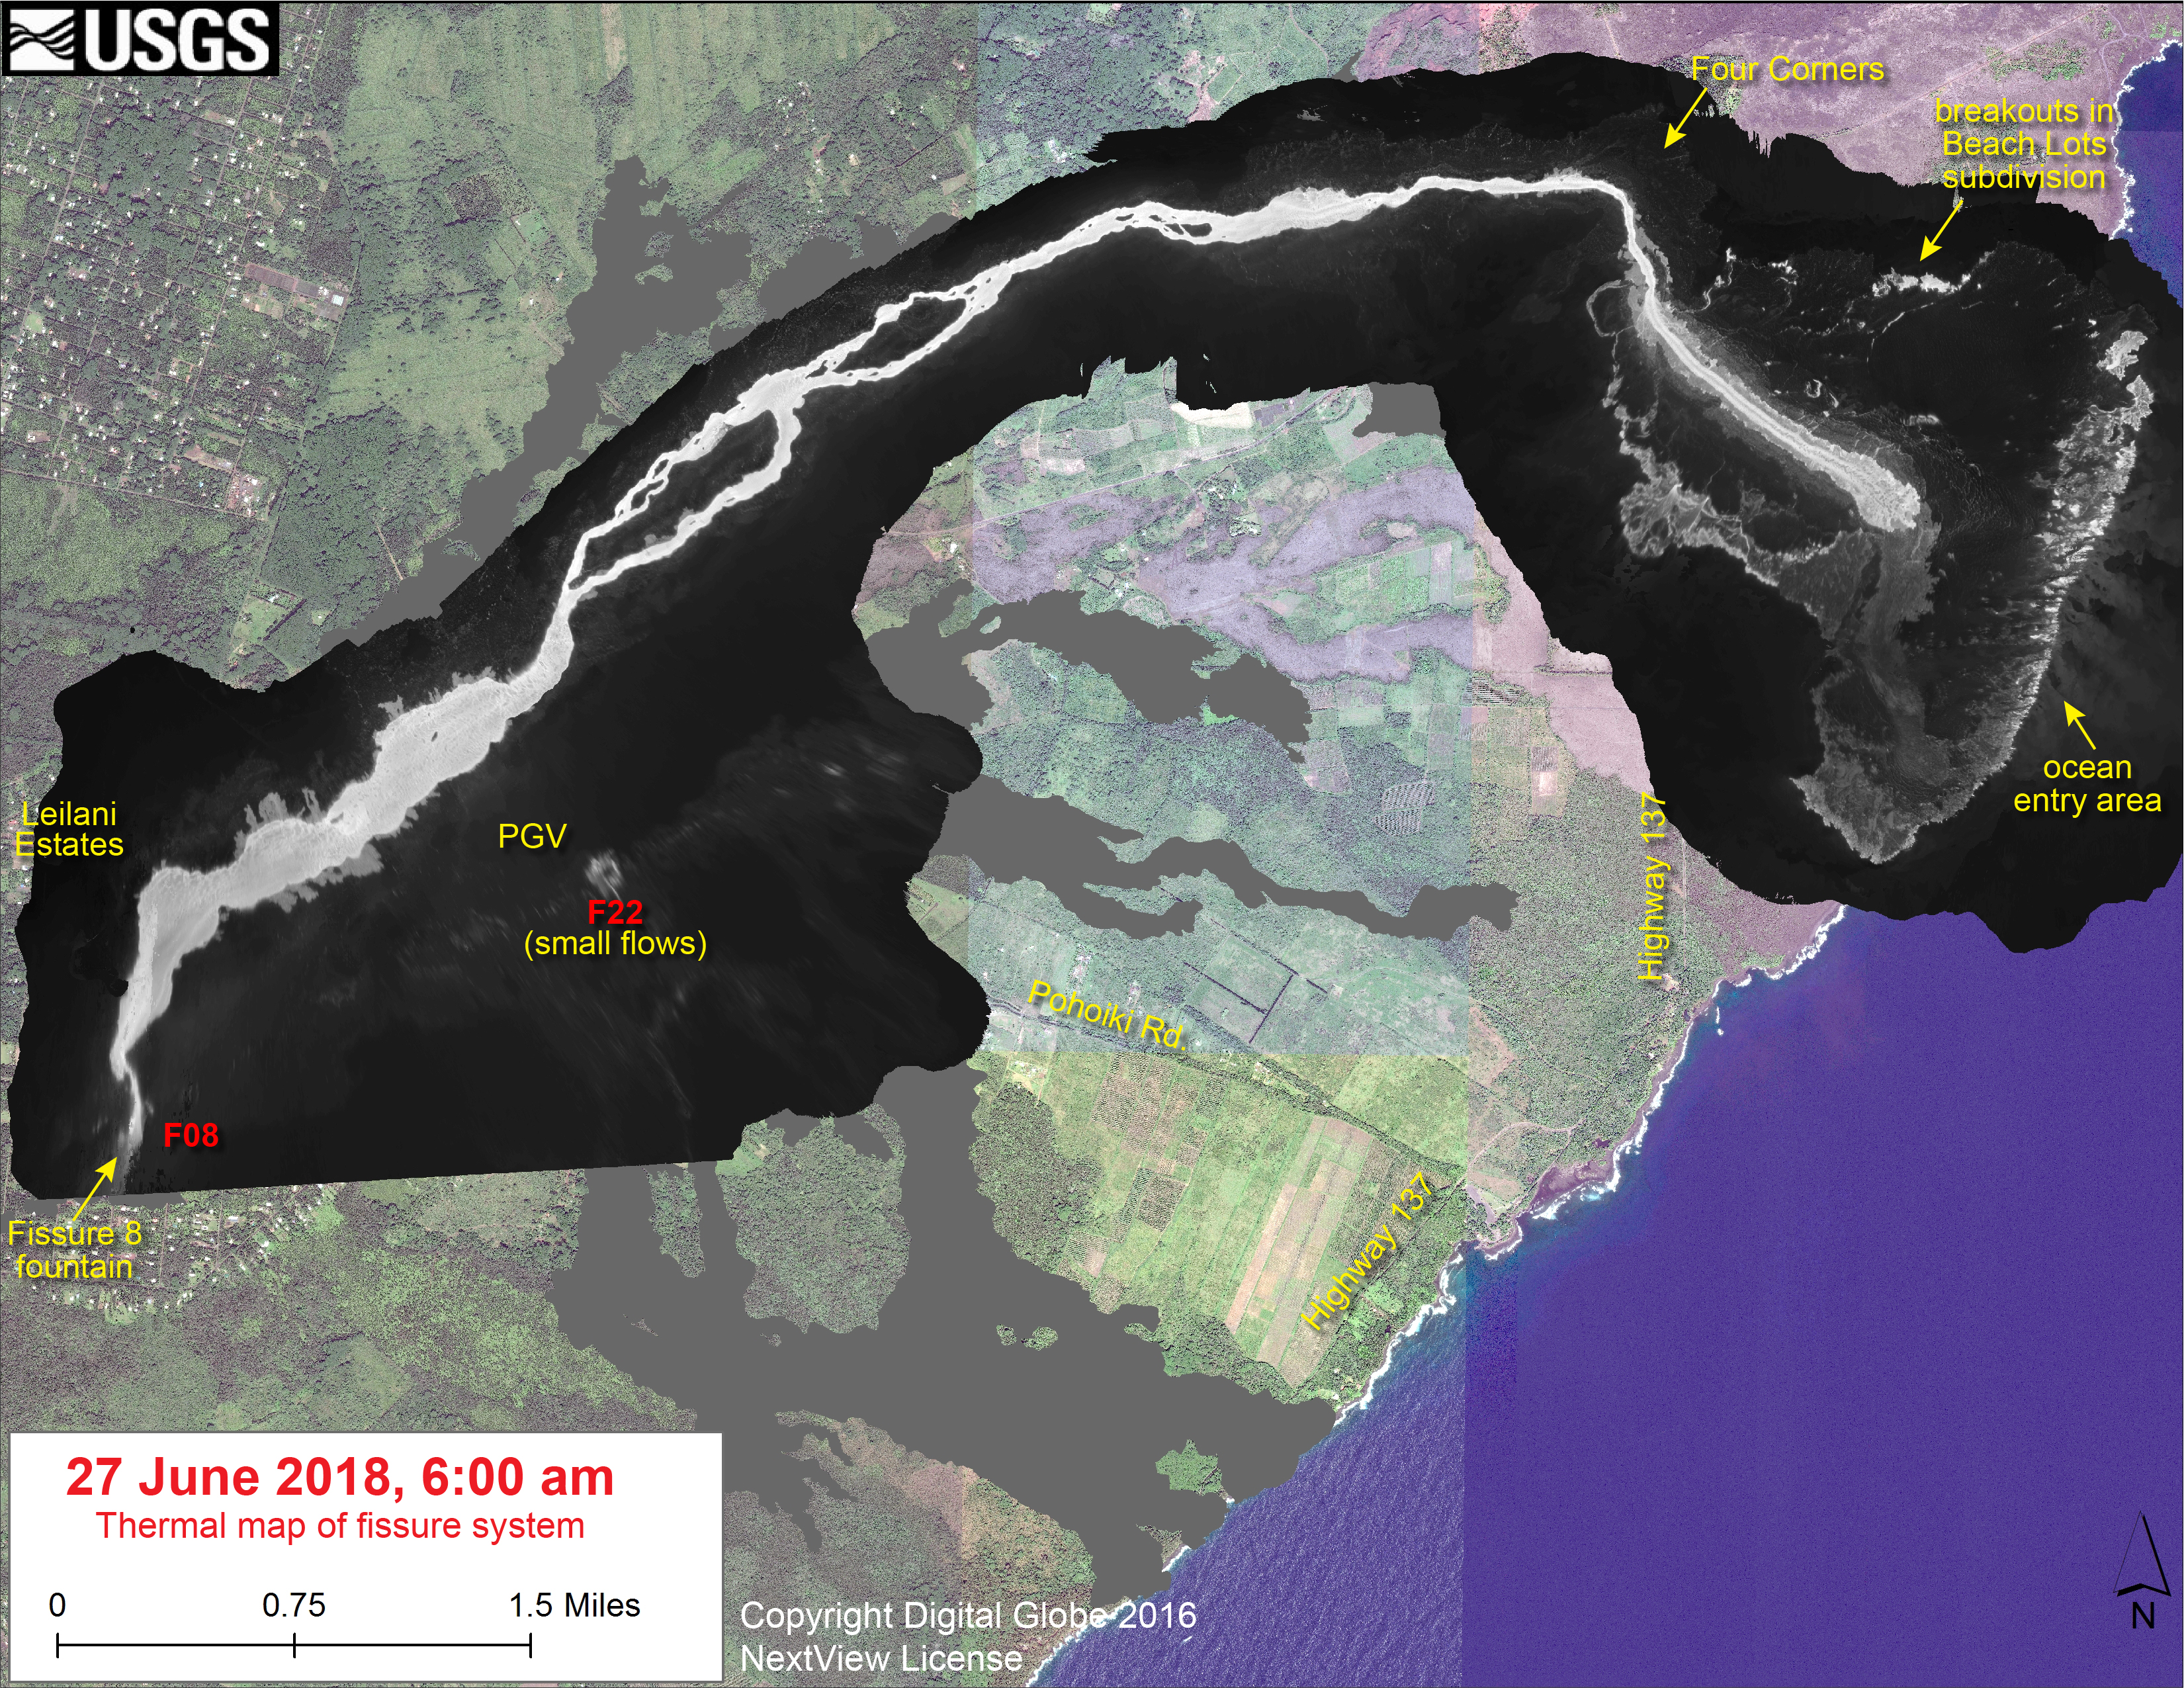
This is my transcript of the July 2, 2018 11am USGS press briefing, which covered lava-created thunderstorms, whirlwinds, and rain; laze-induced lightning; and lava boats. Additionally, Mike Zoellner mentioned findings of a sonar expedition to measure the lava extending on the ocean floor.
Soundfile is archived here. BigIslandVideoNews has also posted most of it, overlaid with recent video footage:
Participants:
Leslie Gordon, USGS Public Affairs
Jessica Ferracane, Hawaii Volcanoes Nat’l Park Public Affairs
Robert Ballard, NWS
Mike Zoeller, HVO & Center for the Study of Active Volcanoes, UHI
Brian Shiro, seismologist, USGS/HVO
Transcript note: I omit salutations/pleasantries, jumping straight to news and information. Also I usually summarize questions to provide just enough context for USGS responses.
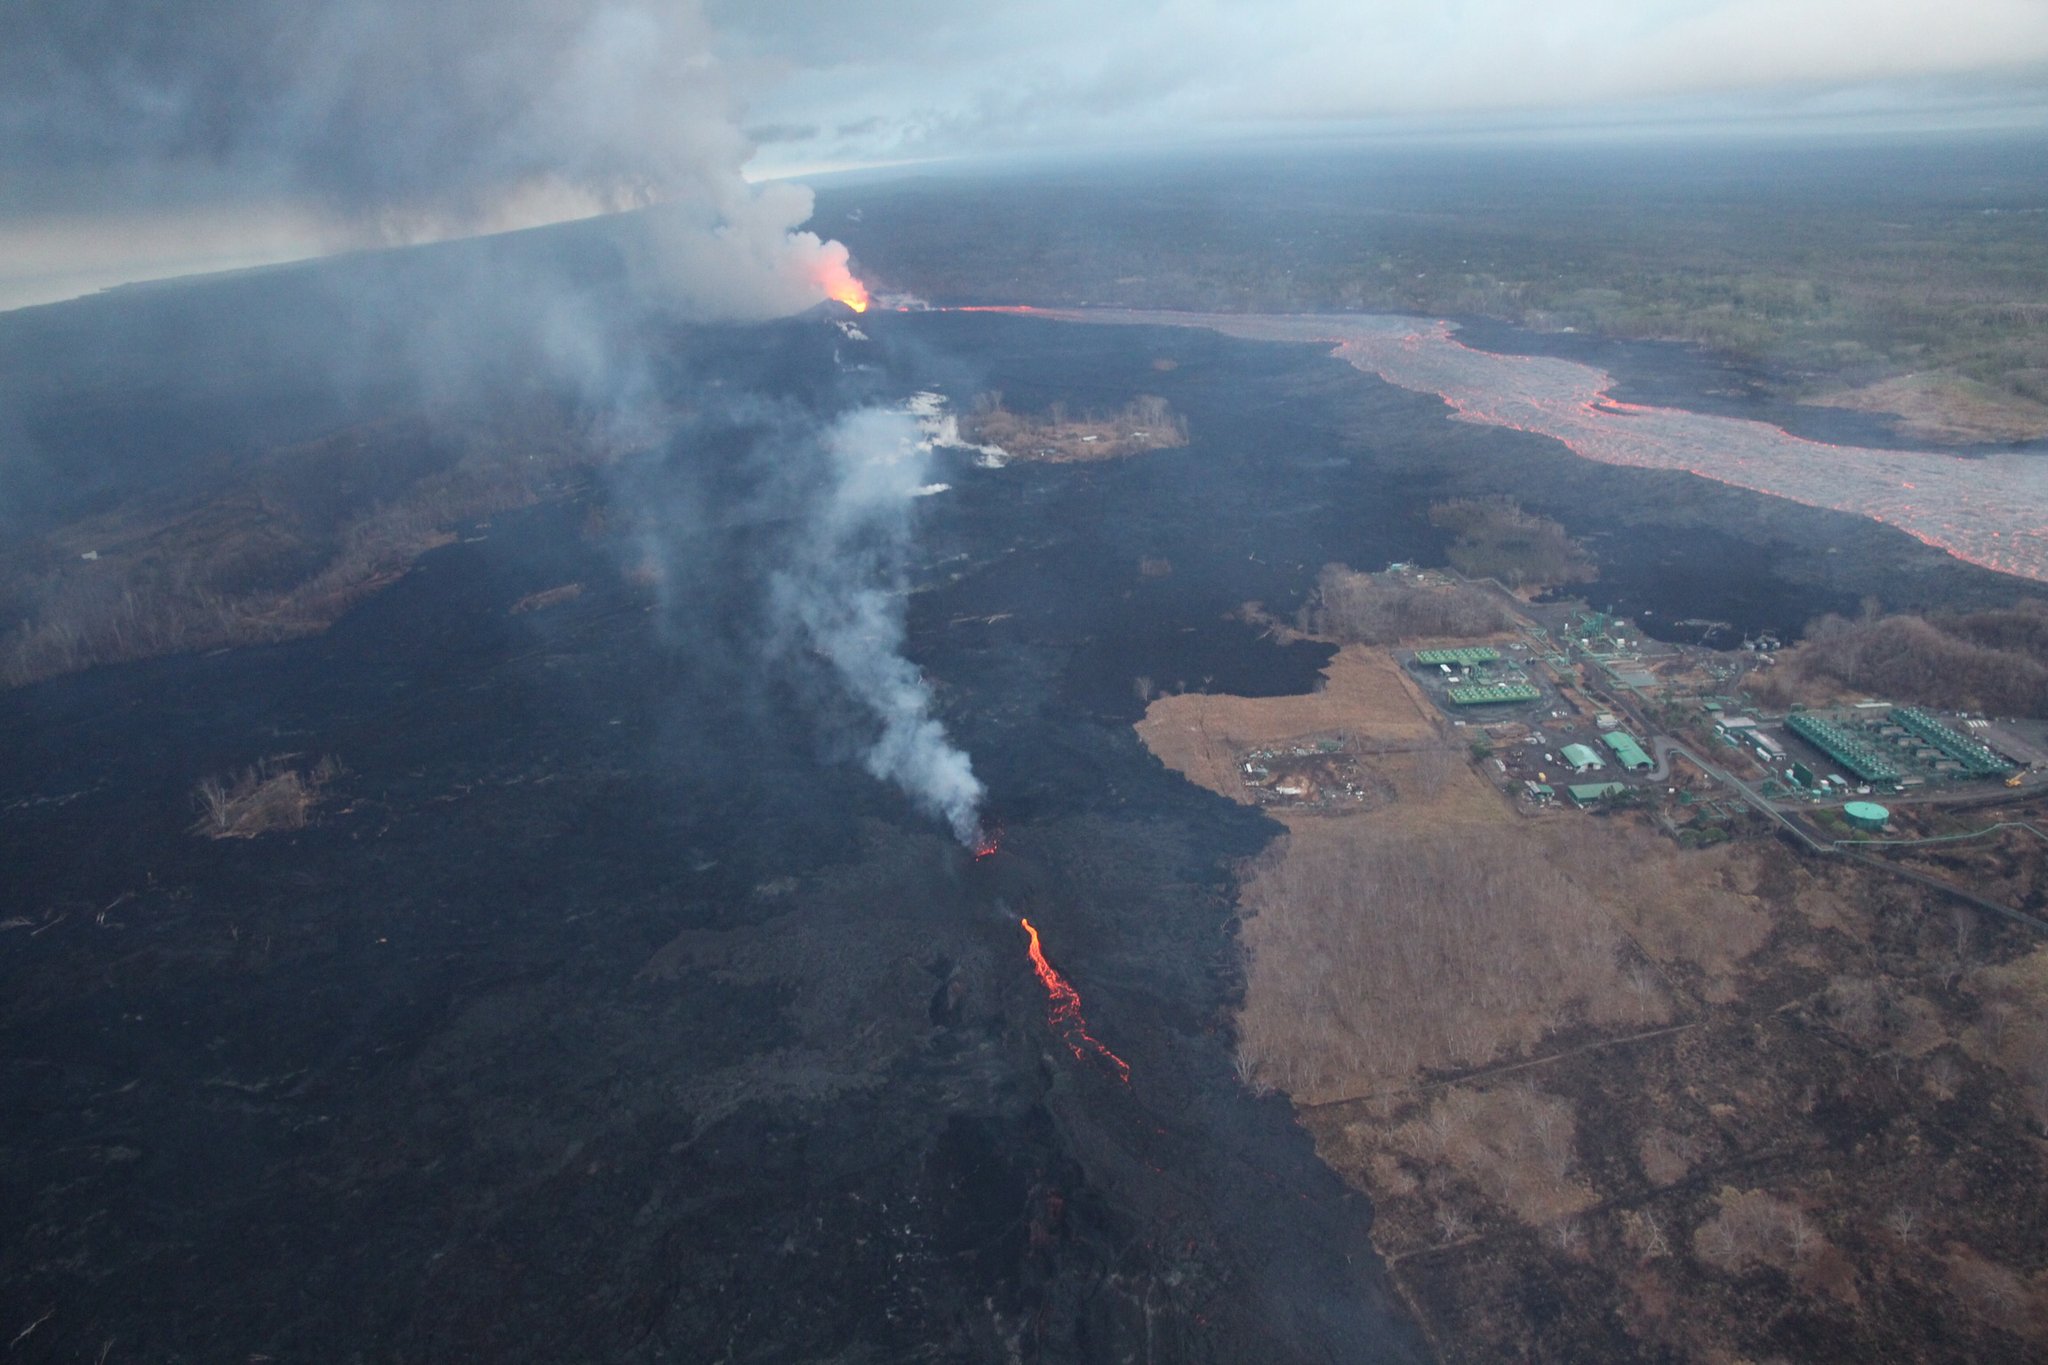
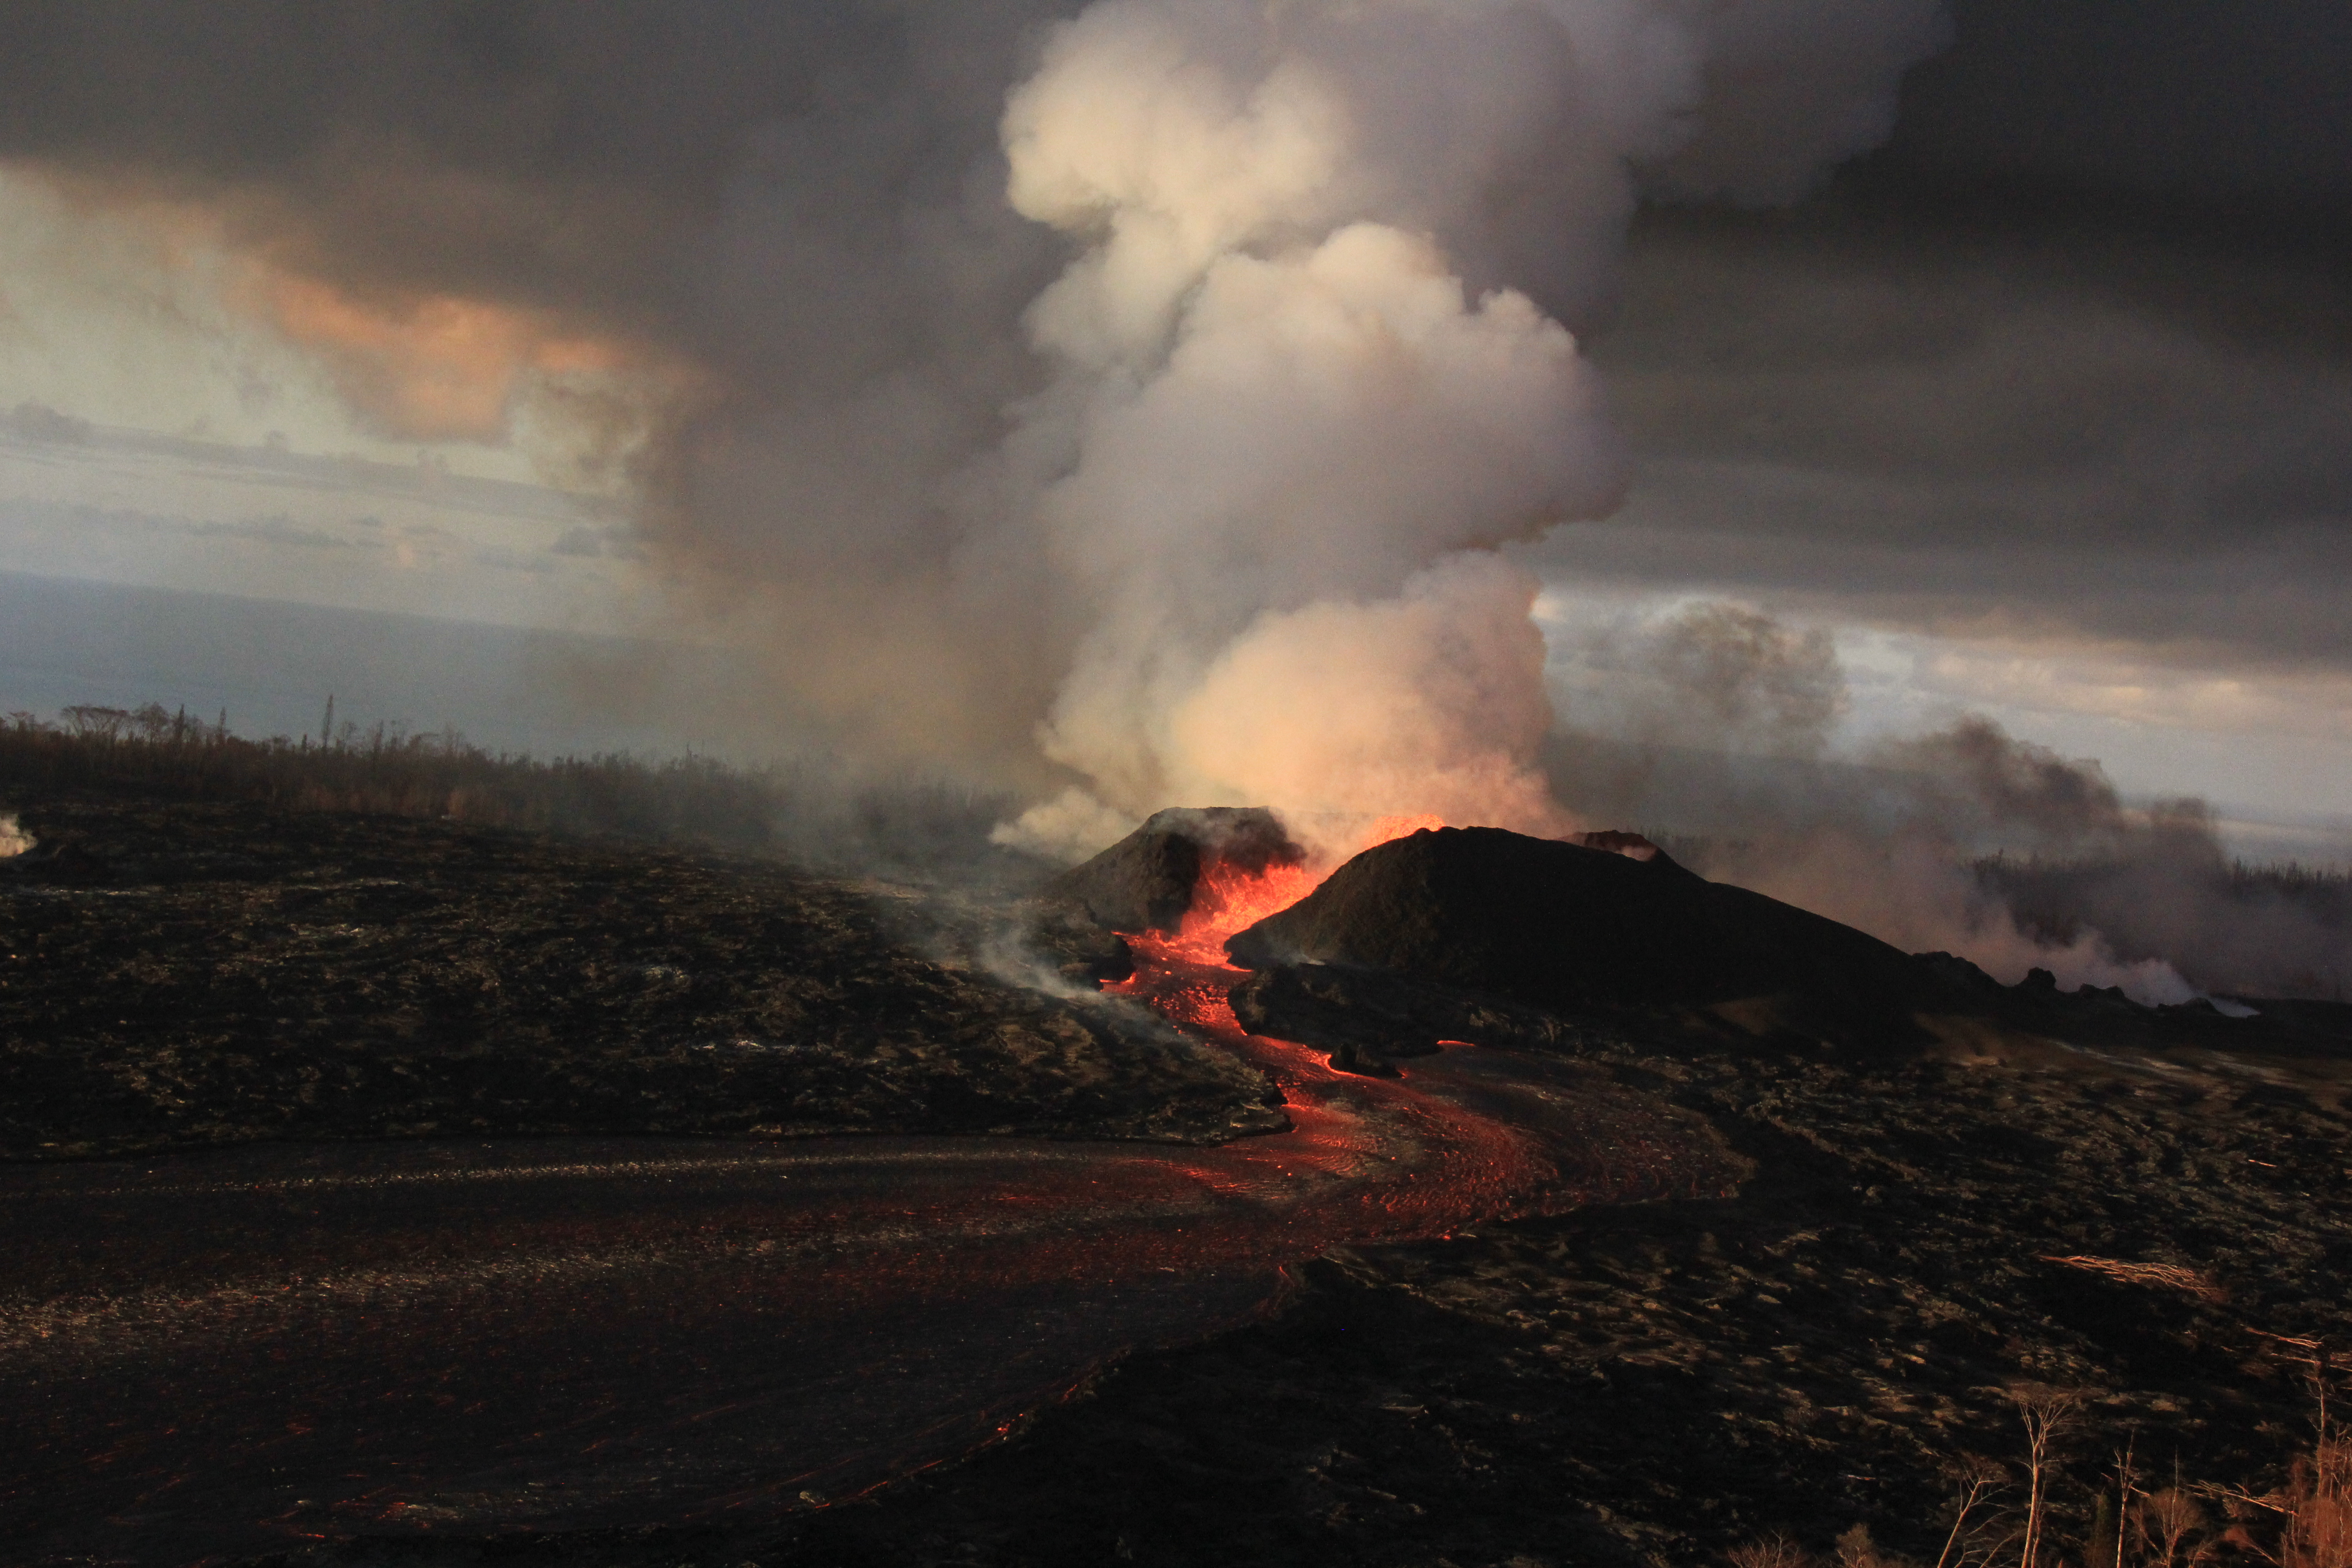
Fissure 8 gushes on unchallenged and unchanged, while Fissure 22 — remember the chief subject of Lavacam?— has started spattering 50-80m and sending out a modest lava flow headed NE along the edge of previous flows.
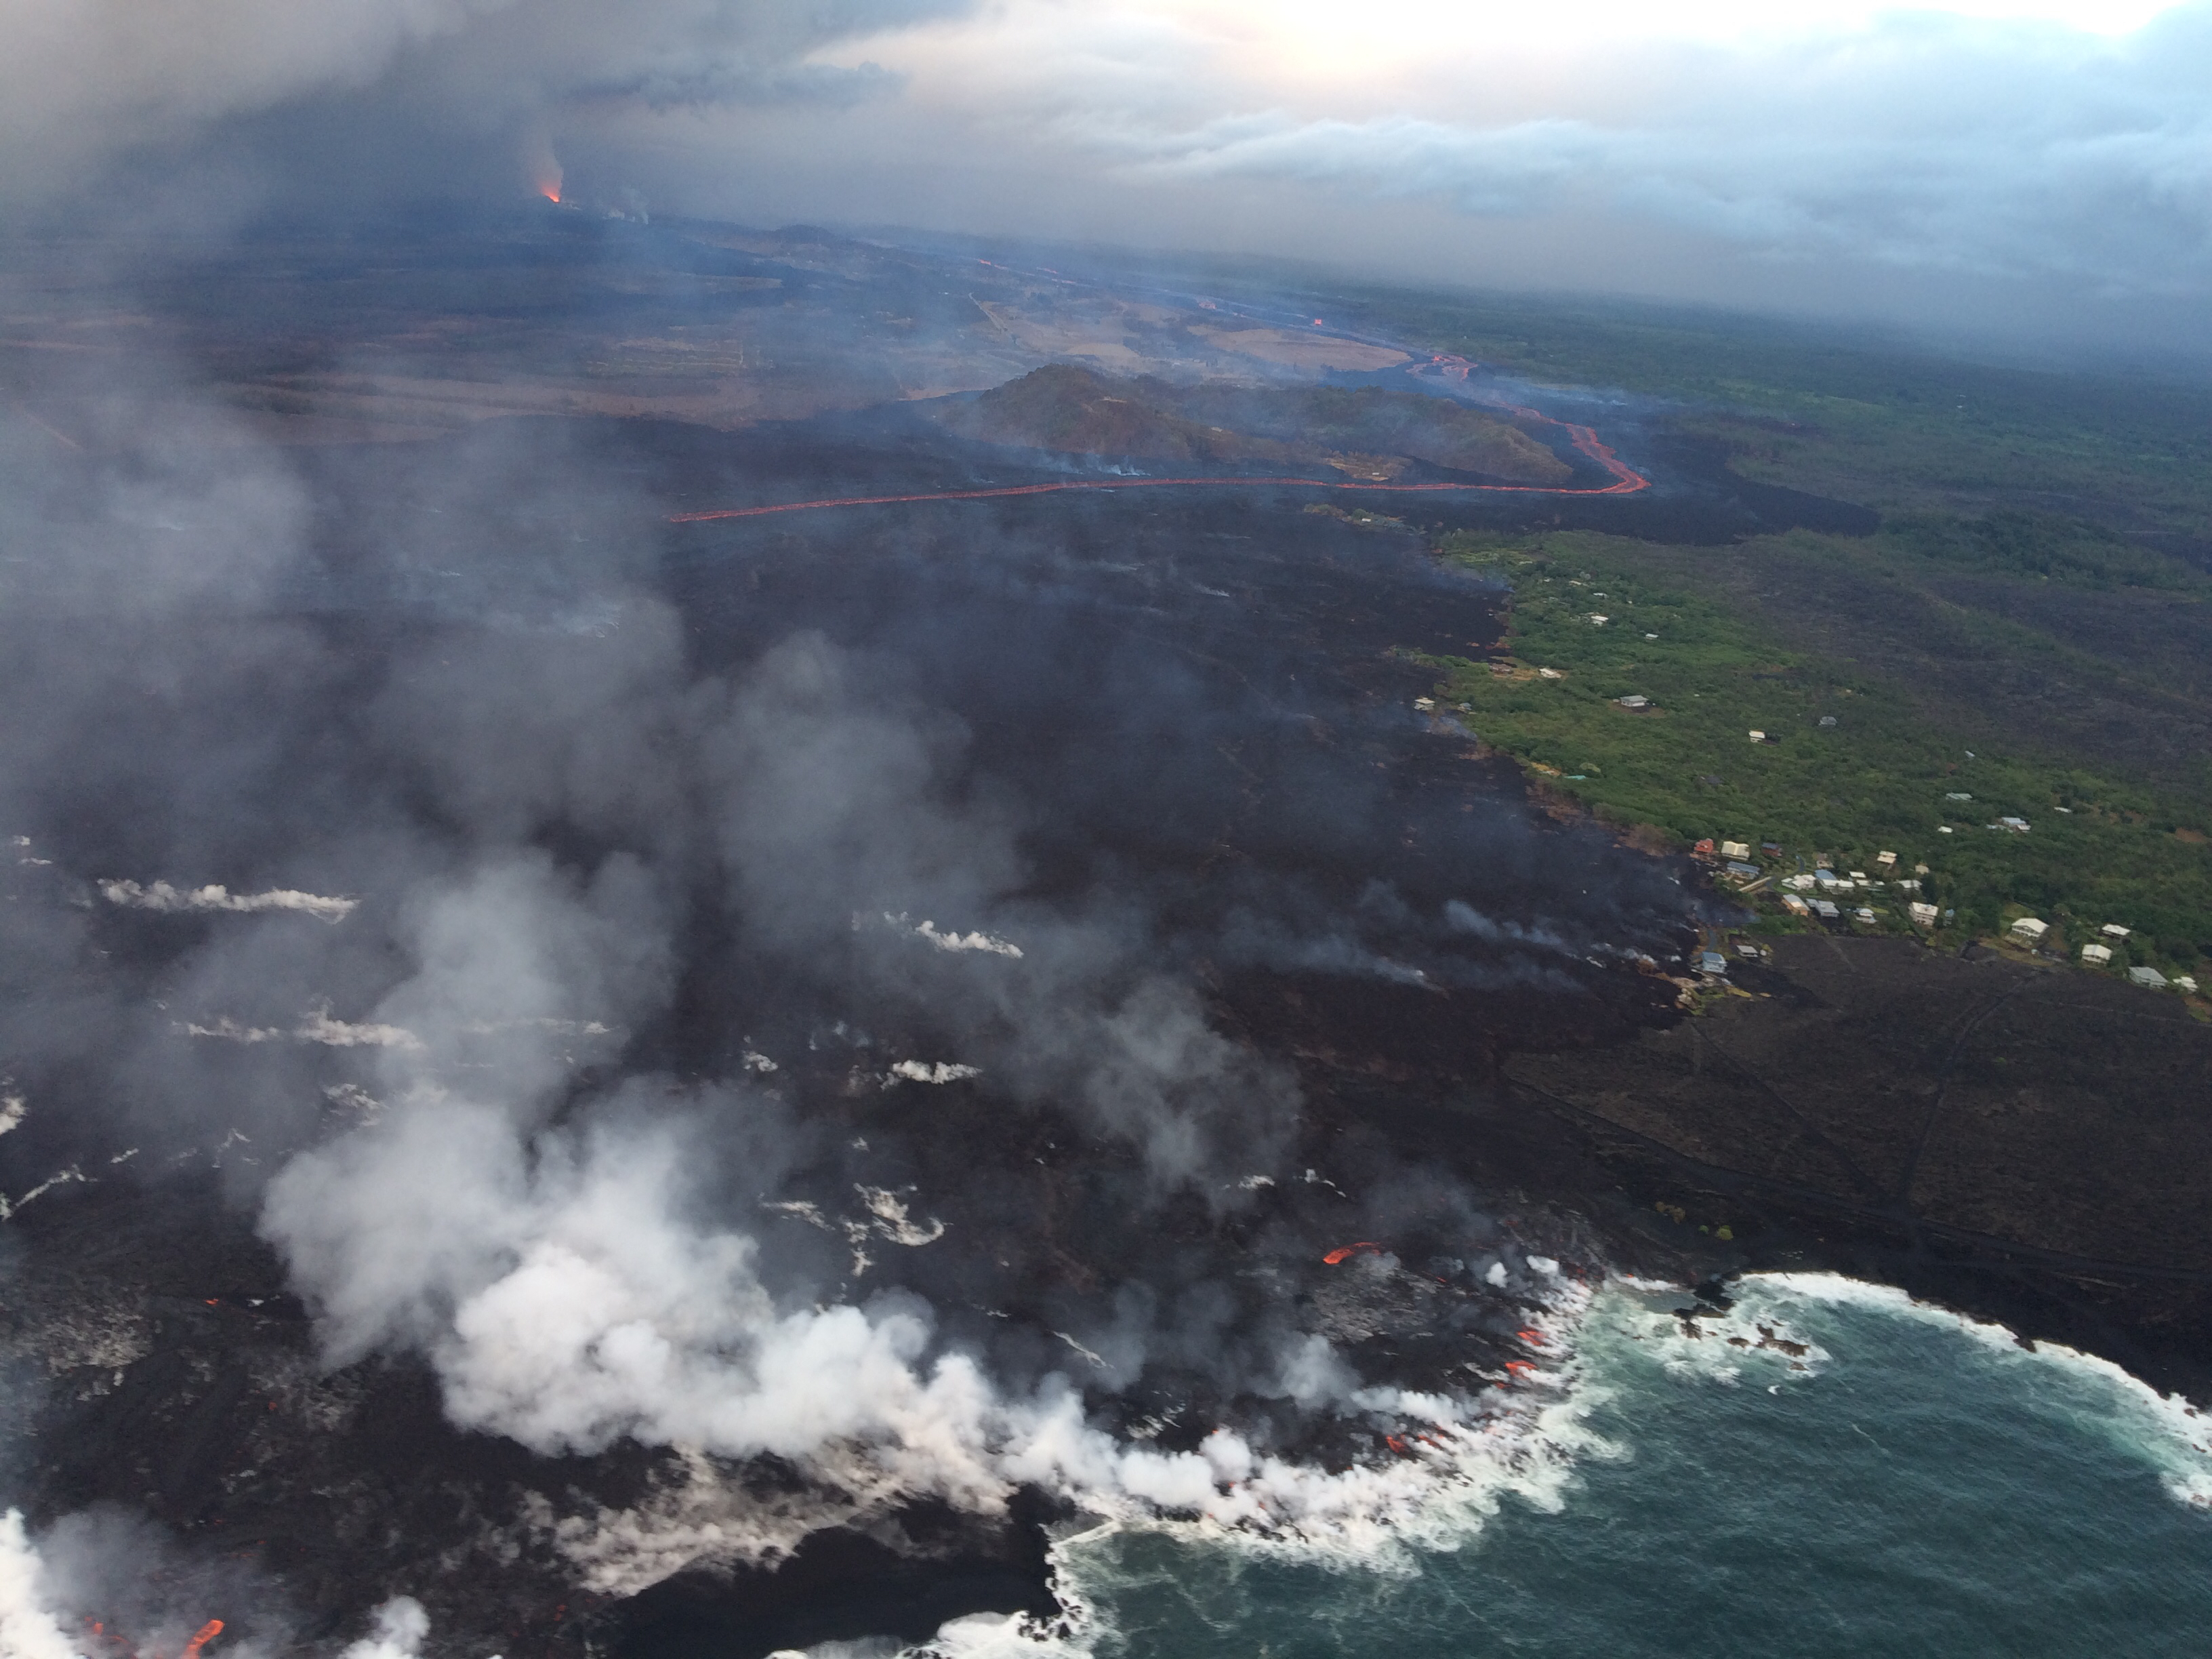
USGS photo from morning overflight, July 1, 2018. Fissure 8 in the distance, Fissure 22 in the middle ground across from PGV. (Full-sized)
Down at the coast, lava continues to ooze out from under much of the northern part of the delta along a broad front, with “pasty” lava squeezing out in several places along Kapoho Beach Lots.
As of 8:30pm 11pm HST, I’m waiting for confirmation of the next summit collapse/explosion.
Besides Fissure 22 reactivating in earnest, the news today is that new digital elevation maps and satellite images give us a clear view of the subsidence of Kilauea Caldera around Halema’uma’u, which has begun to show in livestream and webcam views lately.
First of all, USGS seismologist Kyle Anderson posted this color-coded slide of caldera ground deformation in his Thursday evening talk:
The colors compare the new June 19, 2018 drone-surveillance digital elevation map with a DEM of the caldera captured in 2009. Presumably the light gray areas within Halema’uma’u don’t correspond to anything on the older map, so can’t be compared. Green patches are earthquakes over the past few days indicating stress. And “300+ ft” marks the last known position of the NPIT GPS sensor before it sank out of radio contact. (Full-sized)
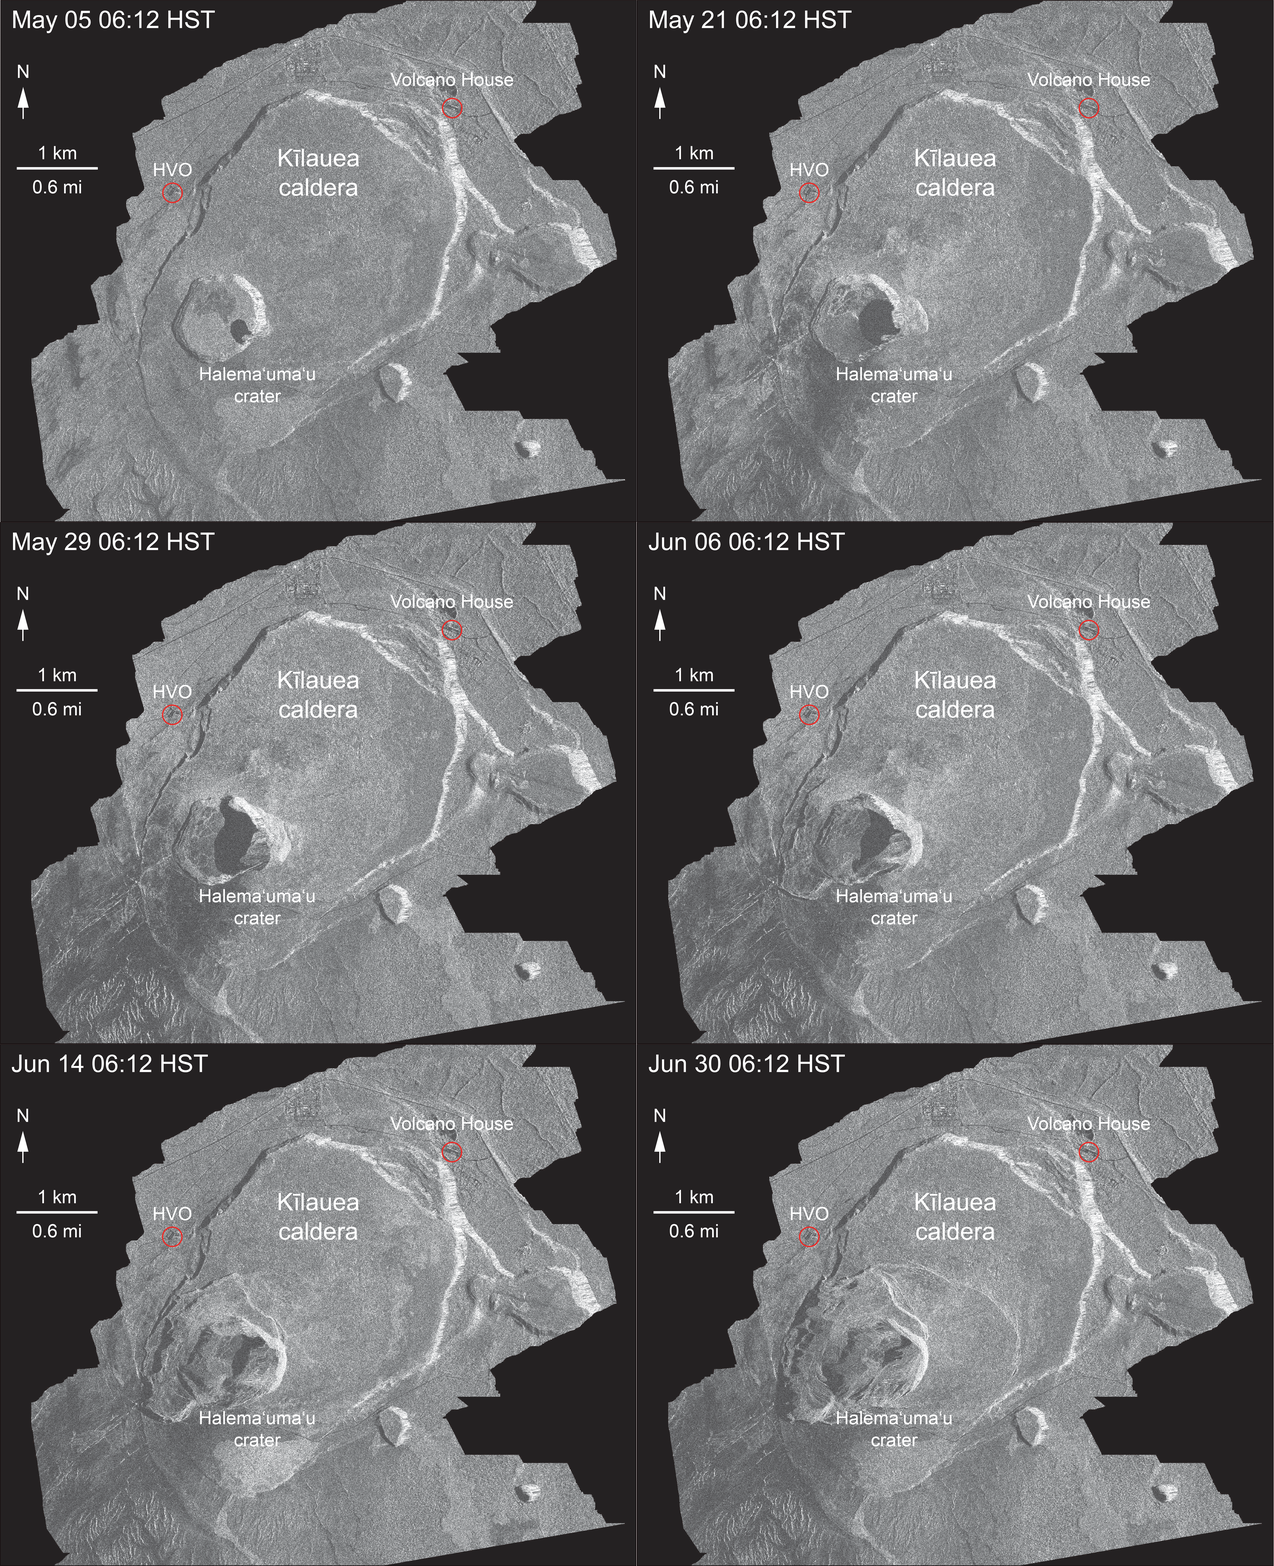
Next, the Italian Space Agency’s trusty Cosmo-Skymed satellite has sent us another radar survey of Kilauea. Even though I’d observed dramatic subsidence of the caldera floor in recent livestream and webcam images, the last frame of this animation made me gasp:
USGS: “This animated GIF shows a sequence of radar amplitude images that were acquired by the Agenzia Spaziale Italiana CosmoSkyMed satellite system. The images illustrate changes to the caldera area of Kīlauea Volcano that occurred between May 5 and June 30 at about 6:00 a.m. HST[…] Over time, expansion of the summit eruptive vent within Halema‘uma‘u crater and the widening of Halema‘uma‘u itself are clear. Starting in late May, the development of several cracks outside Halema‘uma‘u is clear, and inward slumping of a large portion of the western, southwestern, and northern crater rim begins. Much of this motion appears to be coincident with the small explosions from the summit that have taken place on a near daily basis since early June. The most recent radar scene, from June 30, shows the formation of cracks over a broader area of the caldera floor, extending east of Halema‘uma‘u (these cracks are the scarps seen in recent photographs from the Keanakākoʻi overlook area). We expect this slumping to continue as long as the collapse events and overall subsidence persist. (Full-sized)We are well on our way to a nested caldera, with Halema’uma’u taking up over half the larger caldera floor. I’m hoping those earthquakes indicate where the edge of the new inner caldera will be, but I’m not a geologist. Here’s those scarps they mentioned, posted a few days ago:
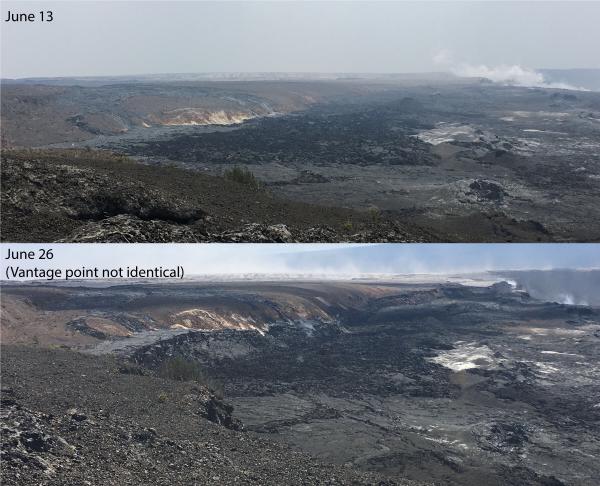
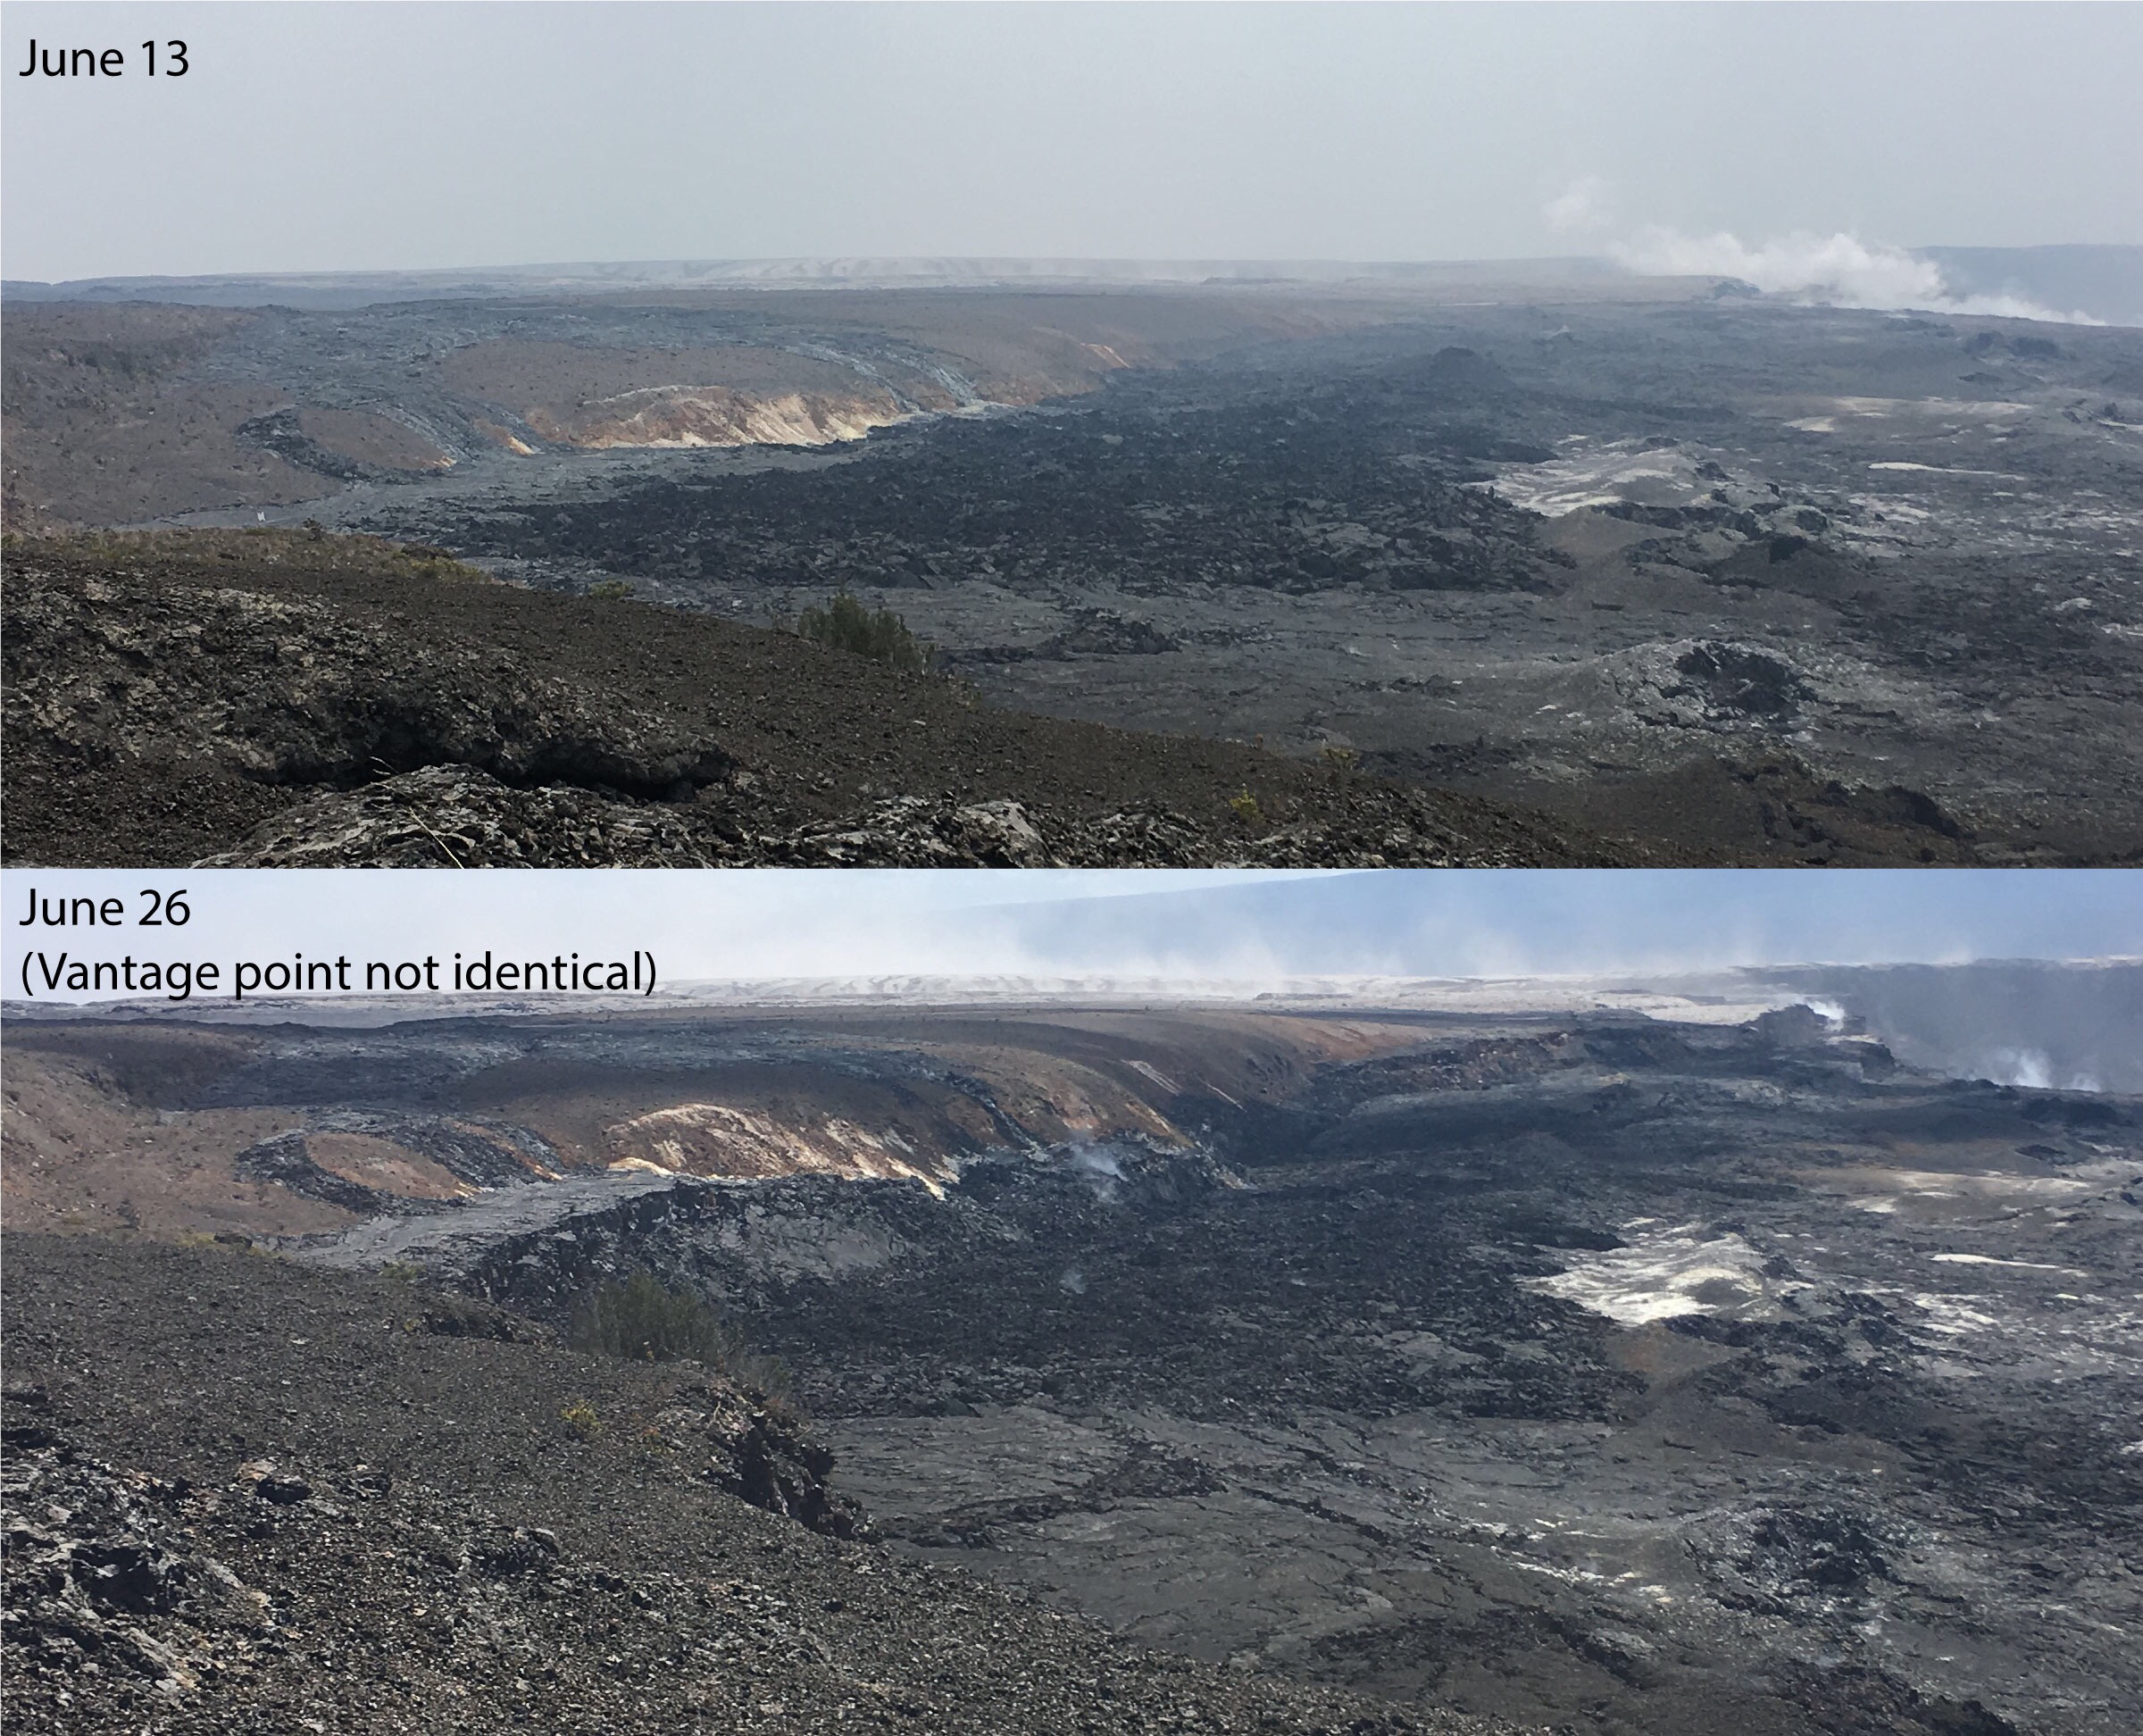
USGS: “Comparison of photographs taken on June 13 and 26 from near Keanakāko’i Crater overlook in Hawai’i Volcanoes National Park shows a subsidence scarp that formed as the Kīlauea Crater floor subsided. Scientists estimate the dramatic dropping of the crater floor in this area occurred sometime between June 23 and 26. The view is to the west. Halema‘uma‘u crater is in upper right.” (Full-sized)
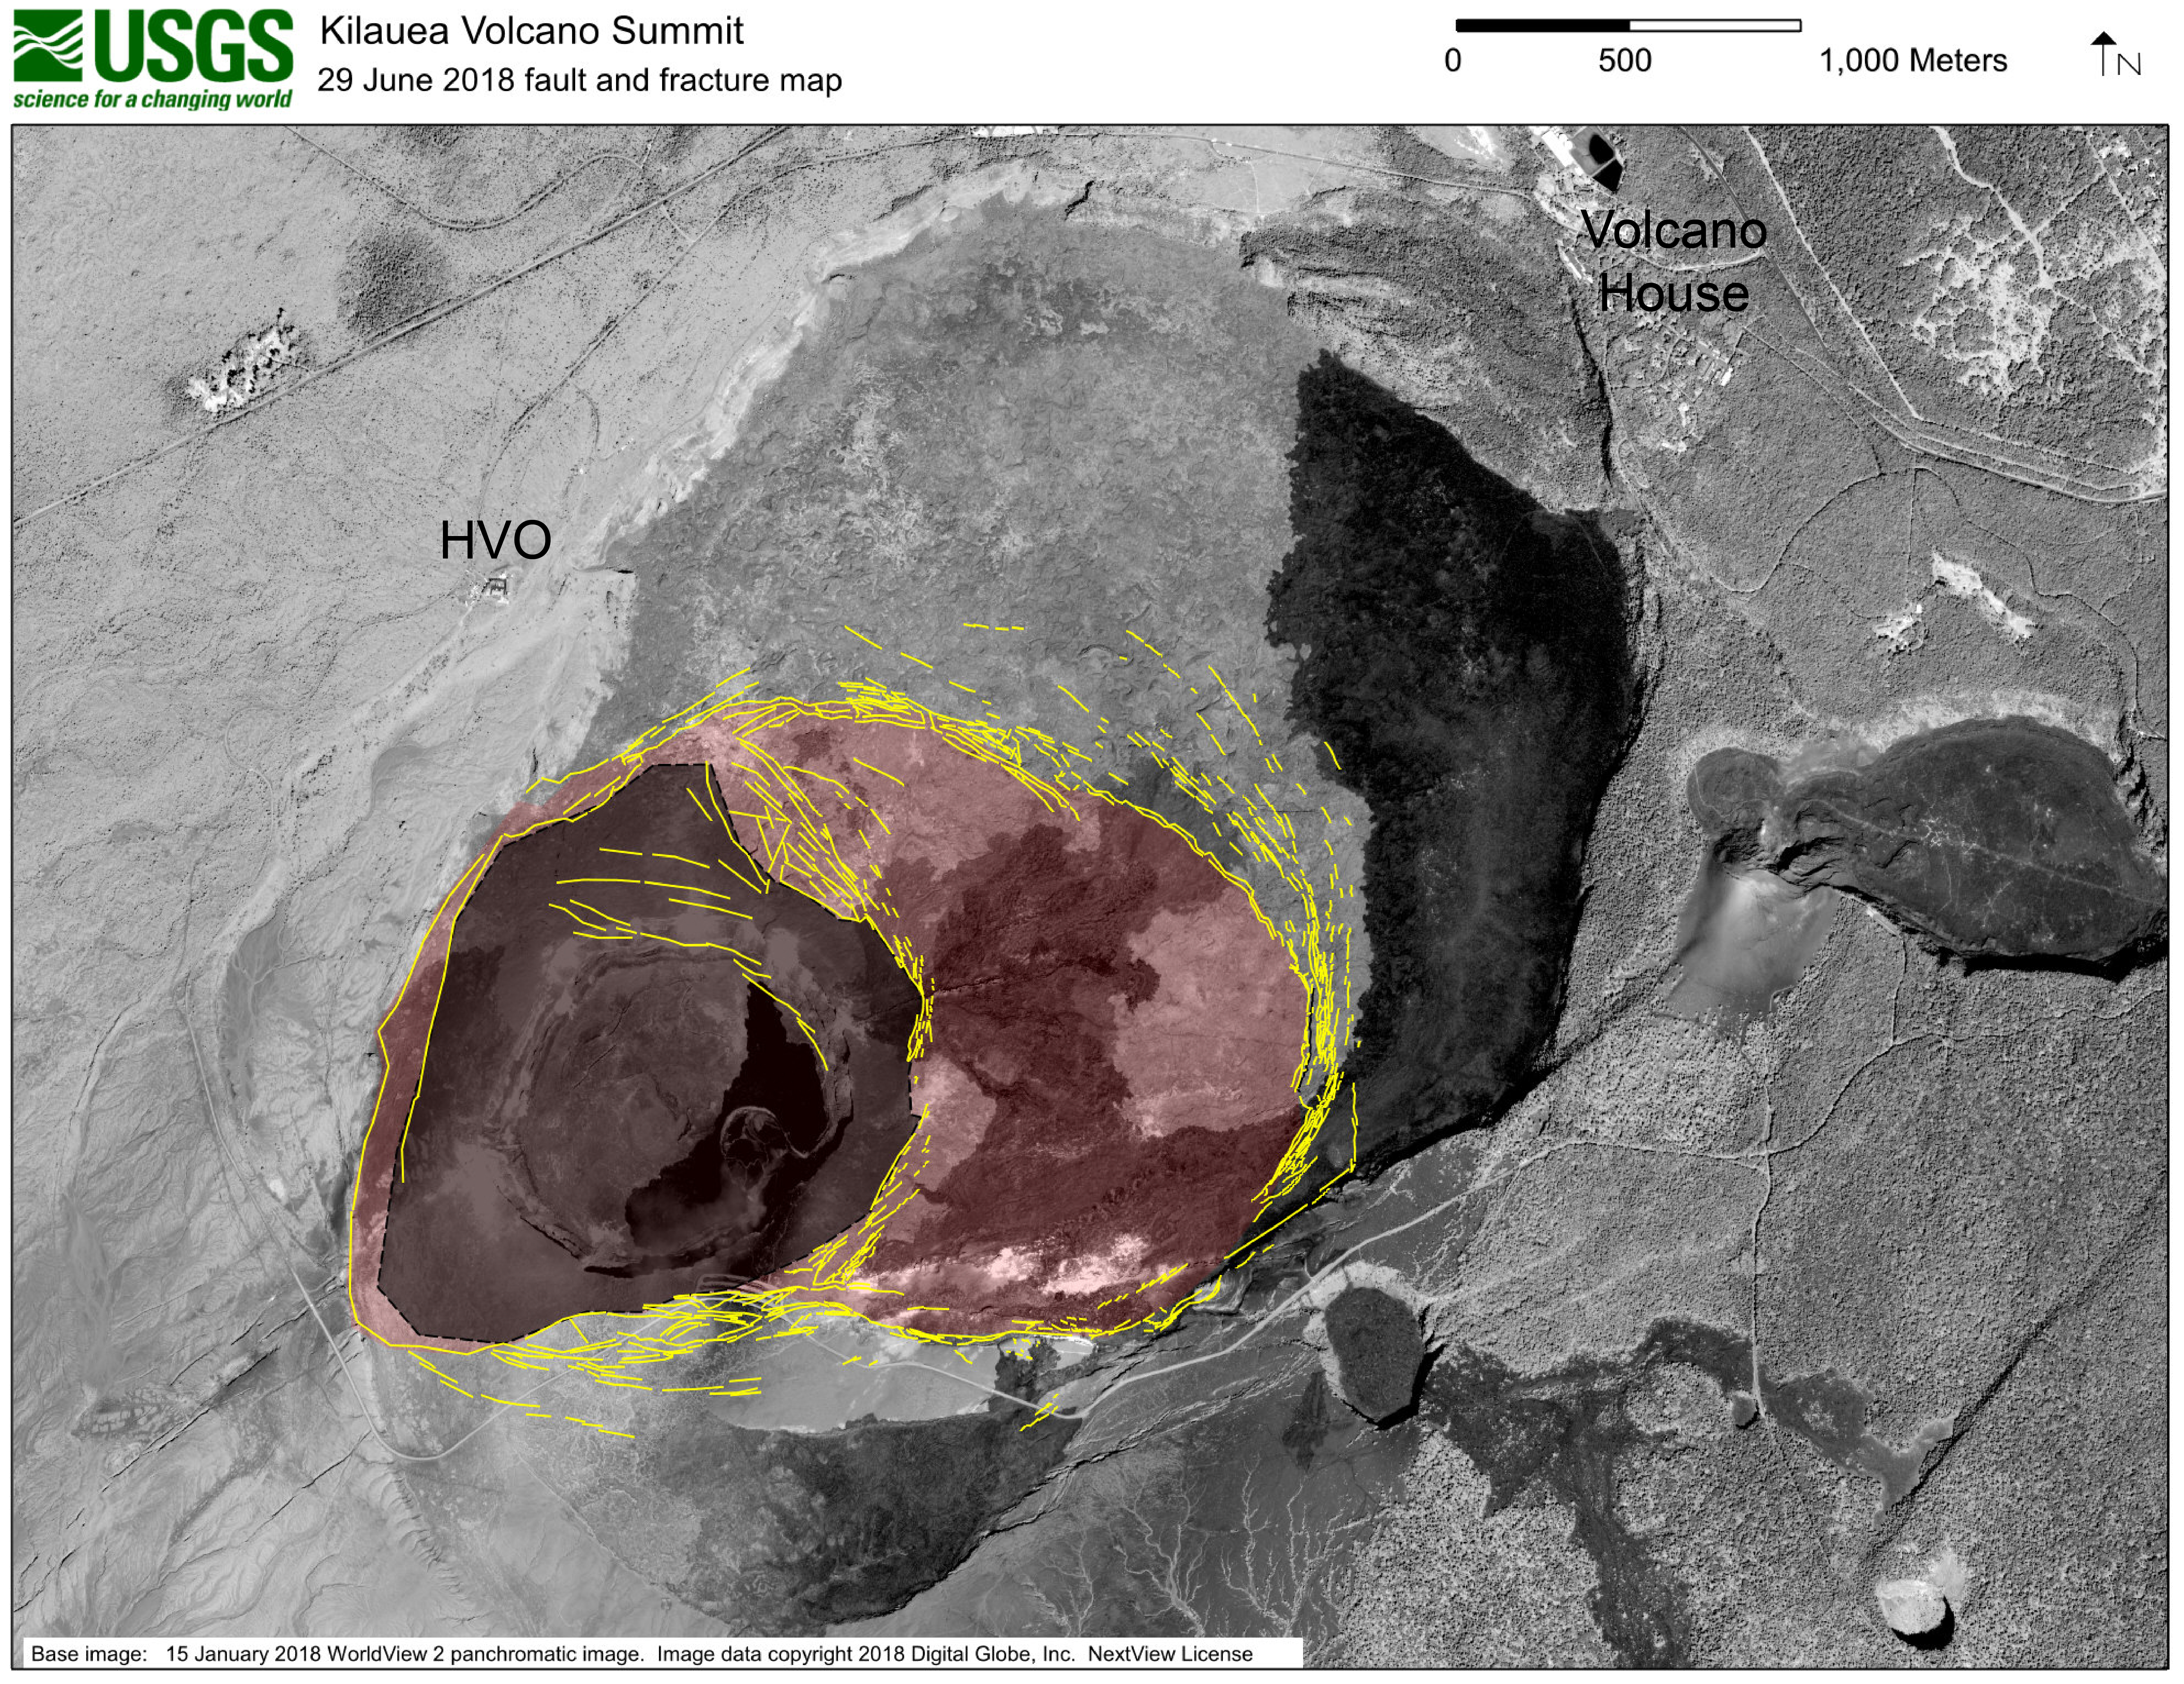
Last but not least, the USGS posted this map of the fracturing around Halema’uma’u. Note that the diagram is projected onto a satellite photo of the pre-May caldera, so there’s a ghostly image of the Halema’uma’u we remember in that dark gray area.
USGS: “This map shows major fractures in yellow (as of June 29) on a base image acquired by the WorldView-2 satellite before the current sequence of events began at Kīlauea. The area of major subsidence has expanded east and south, and slightly west, of the main Halema‘uma‘u crater area. The large, red-shaded area east of Halema‘uma‘u is moving down within a scarp-bounded area, as seen in recent photographs of the summit. Some fractures have also formed to the east-northeast of the red-shaded area of accelerated motion, and also on the south caldera rim where parts of the caldera wall have slumped into the rapidly moving caldera floor below. The dark gray-shaded area within the red shaded area shows the region of most significant down dropping and is currently the deepest part of Kīlauea caldera.” (Full-sized)
So there you have it. Who would’ve thought the draining of the lava lake, which was minuscule compared to the whole summit caldera, would’ve had a domino effect this large?
This continues my transcription of the Thurs Jun 28 USGS presentation at Volcano Village. Part 1 transcribed HVO Scientist-in-Charge Tina Neal and seismologist Kyle Anderson’s remarks. Part 2 covers senior volcanologist and my longtime hero Don Swanson’s remarks.
Here’s the video of the entire 1.5 hour meeting. Don’s presentation starts at 15:50:
It sounds like Swanson’s been holed up in Volcano House after HVO was evacuated. (Kyle Anderson: “Don has spent more time viewing this eruption from the summit than anyone else.”)
Title of talk: “Comparisons of Halemaʻumaʻu Crater, May 19 through June 28 Viewed from dining room table of Volcano House”
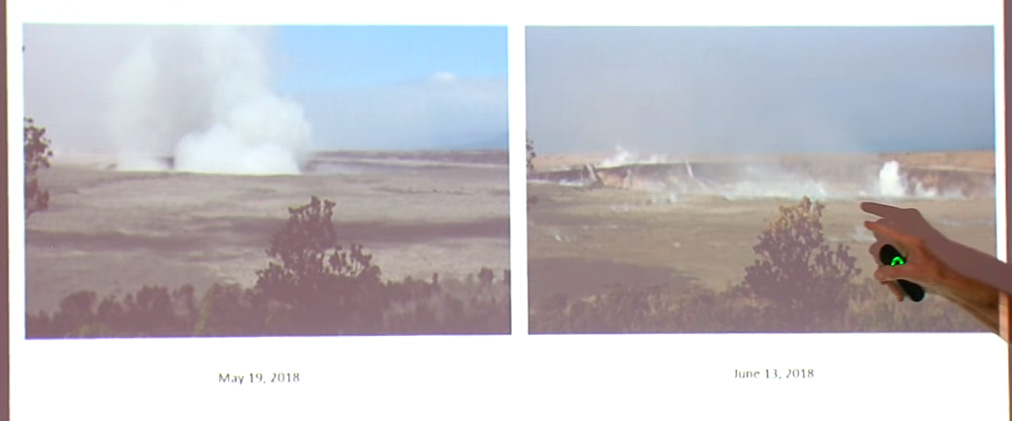
The data that Kyle showed are absolutely magnificent. What I want to do now is to show you some photographs of features that I’ve been able to see during my observations. The first will be a series of photographs of Halemaʻumaʻu taken from the seat in the dining room of the Volcano House hotel where I sit and observe things.
Screencap of first slide in Don Swanson’s presentation. In USGS archives: [May 19] [June 13]On May 19th, of course, things were just starting to get going, but over here on June 13th, you can see that the crater has widened dramatically, and notice that it’s also dropped to the top of the tree which was way below the— it’s come way down. It isn’t because the tree is growing! It’s because the crater is dropping down.
Now we’ll go to this next period, June 13th to the 17th.
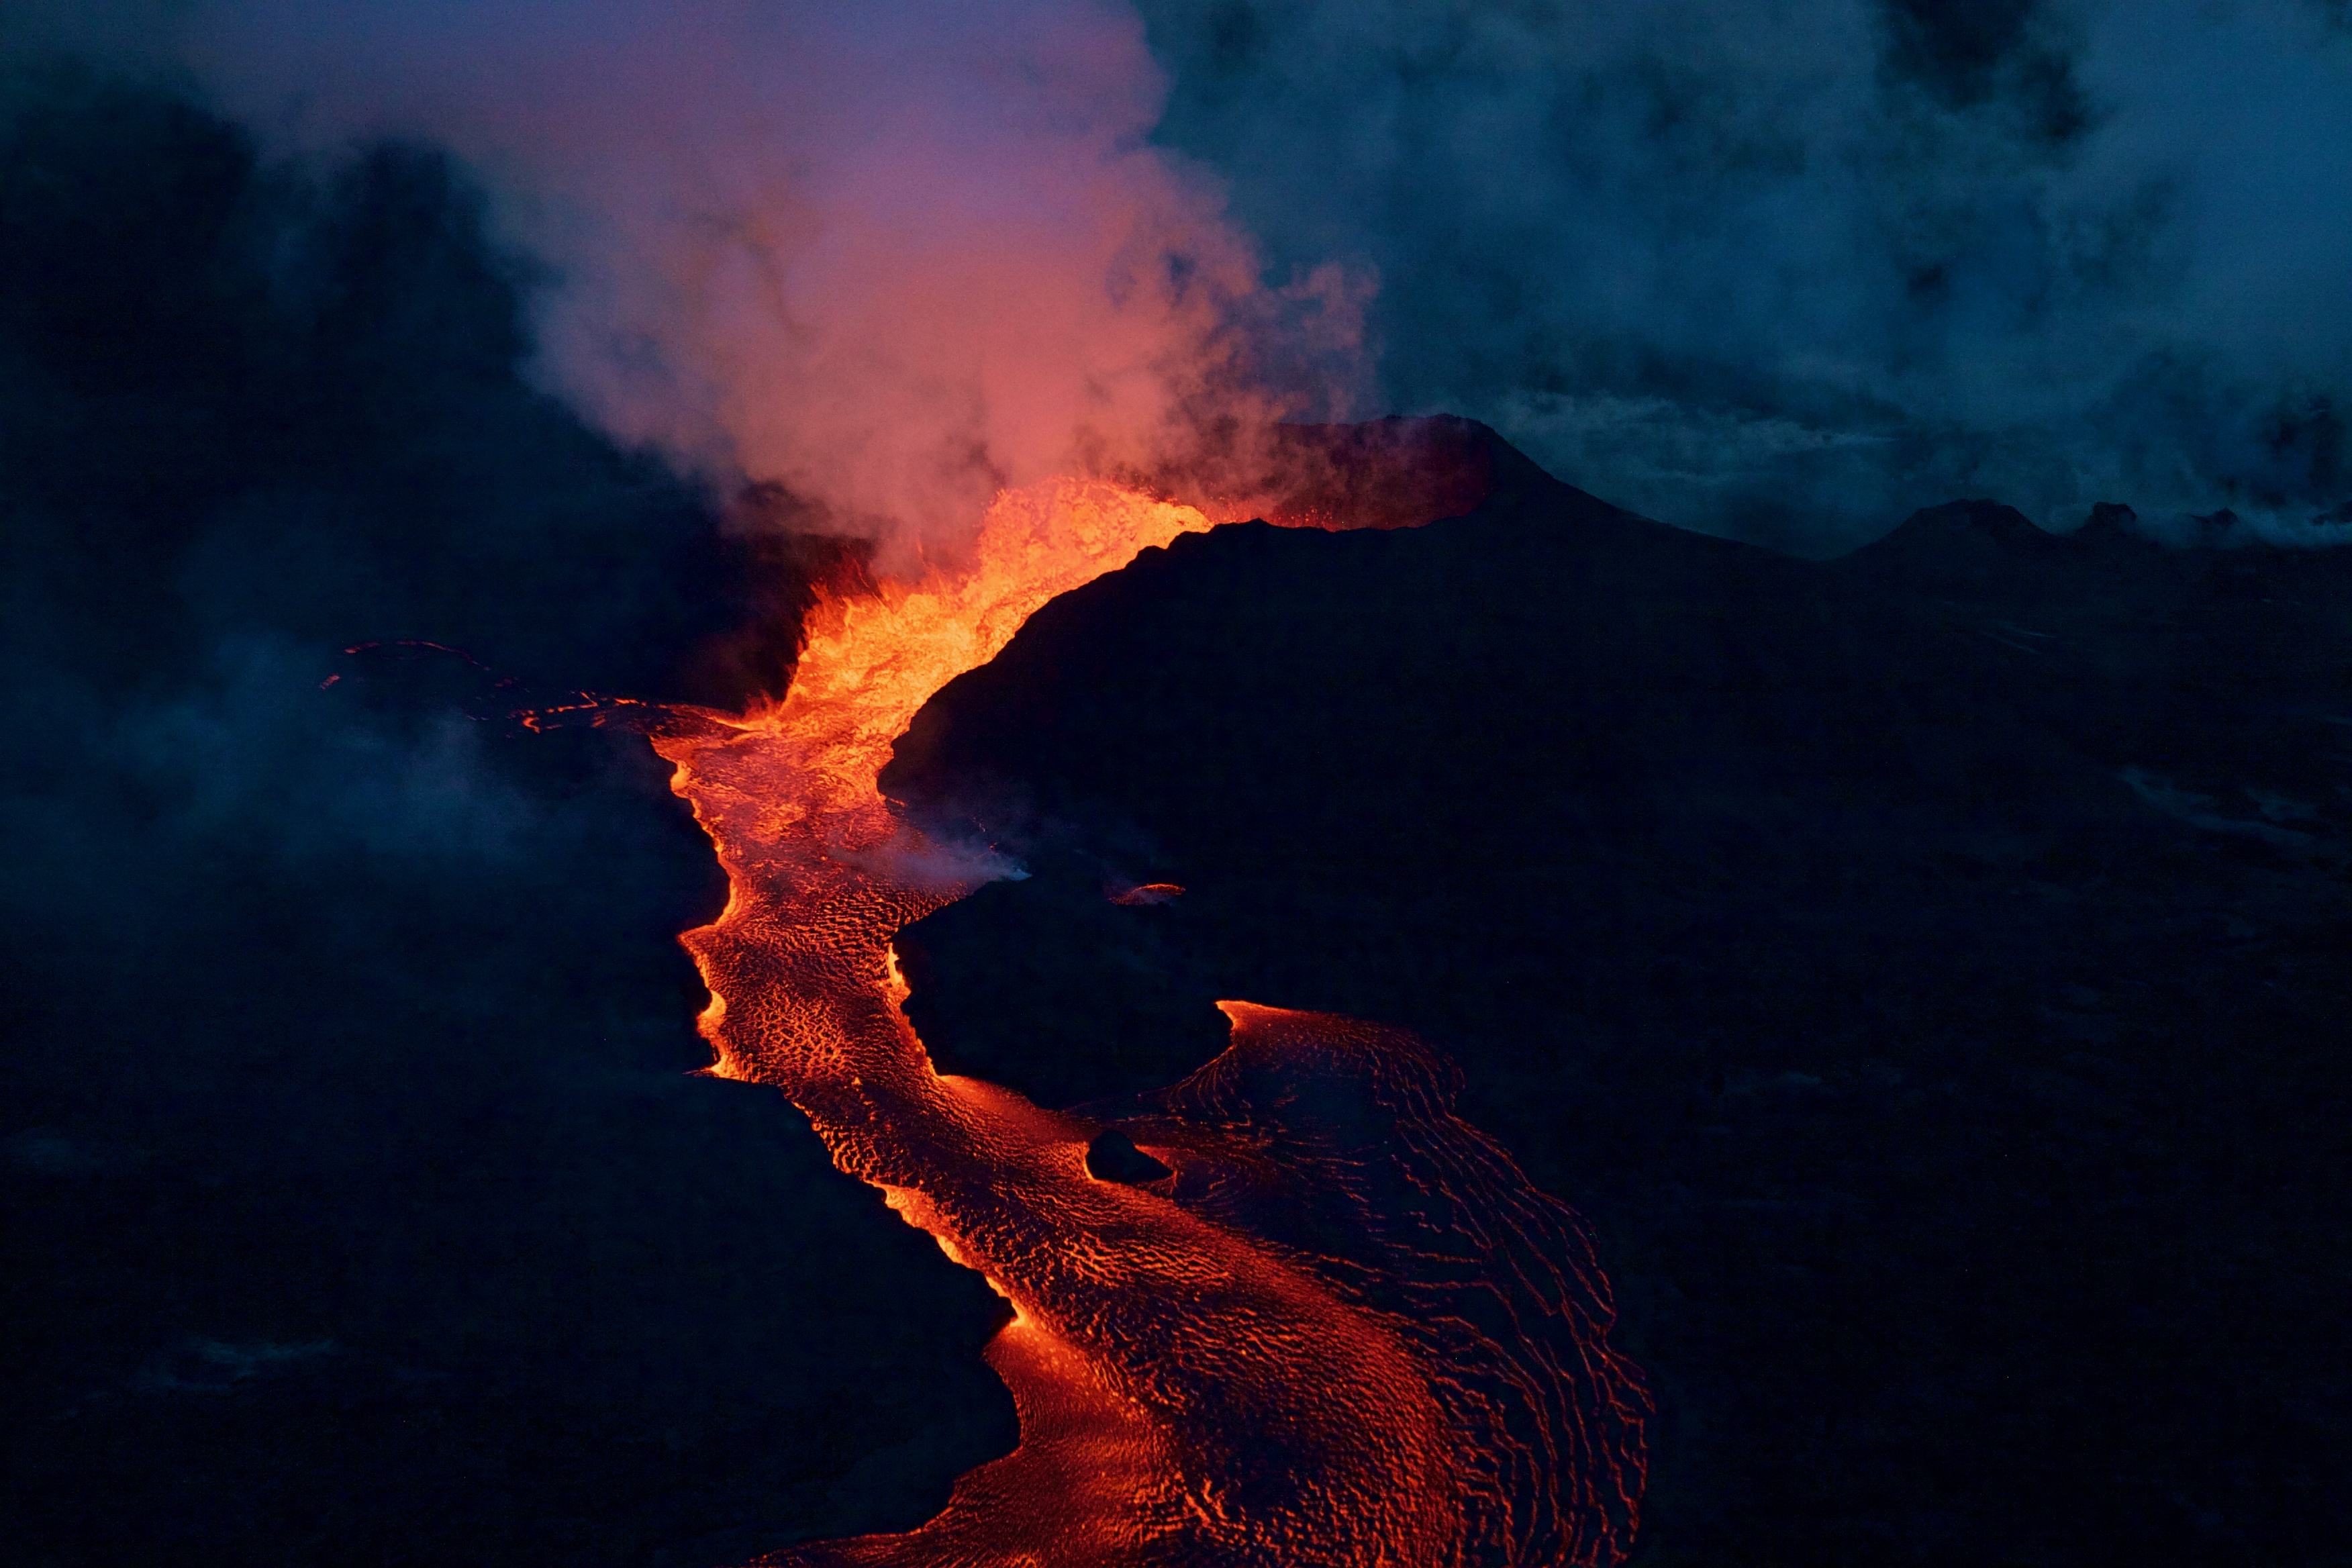
Fissure 8 continues to behave much as it has for the last month or so, looking ever more like a Mordor backdrop:
June 30, 2018: Fissure 8 looking Mordor-like during the USGS morning overflight. (Full-sized)
Today’s official HVO Kilauea update is a copy-and-paste of yesterday’s, apart from this small addition describing the lava delta: “lava is moving beneath the crust and into [the] still-molten interior of earlier flows before it enters the sea in multiple oozeouts.” Like this:
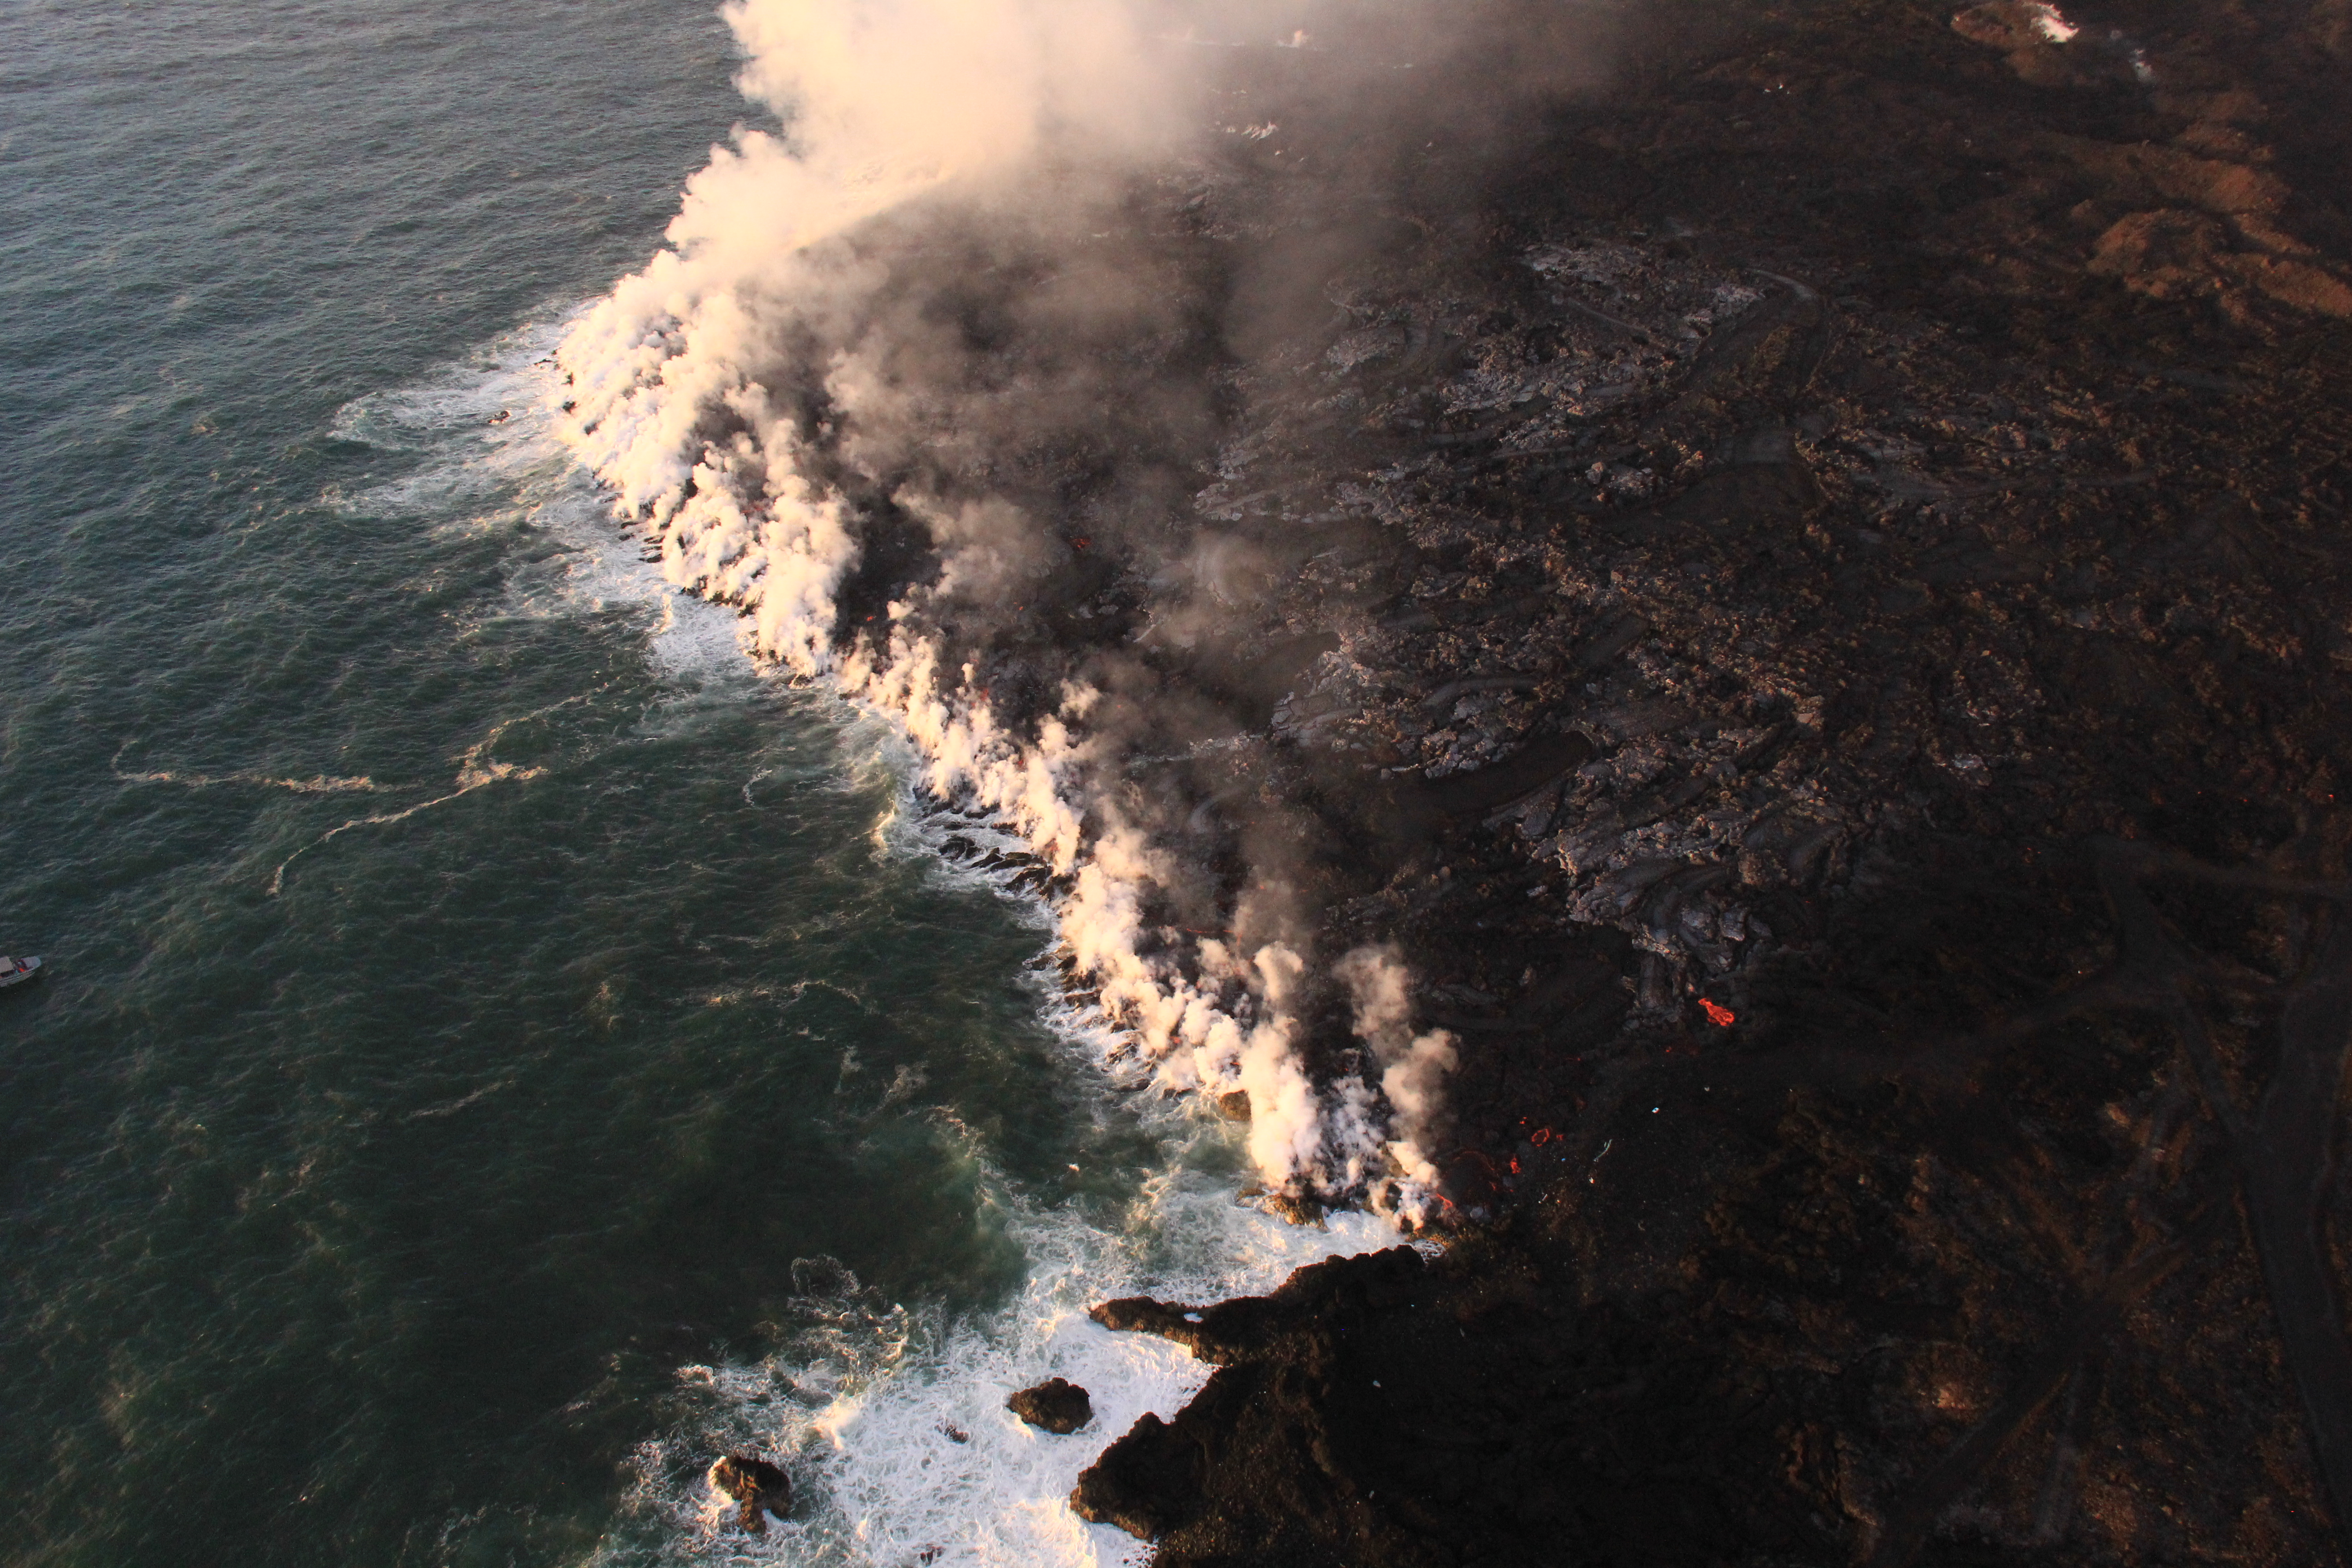
USGS: “Lava was entering the ocean over a broad area this morning. This image shows an active entry area along the northern flow front at Kapoho. View to the south.” (Full-sized)
Unfortunately, some of those “oozeouts” are occurring at the edge of Kapoho Beach Lots as well. At least one home burned today, perhaps more.
Check the Hawaii County Fire Department photos later in this post (or the Bruce Omori photos at the end of the post) to see what the slow-moving expansion into Kapoho Beach Lots looks like right now.
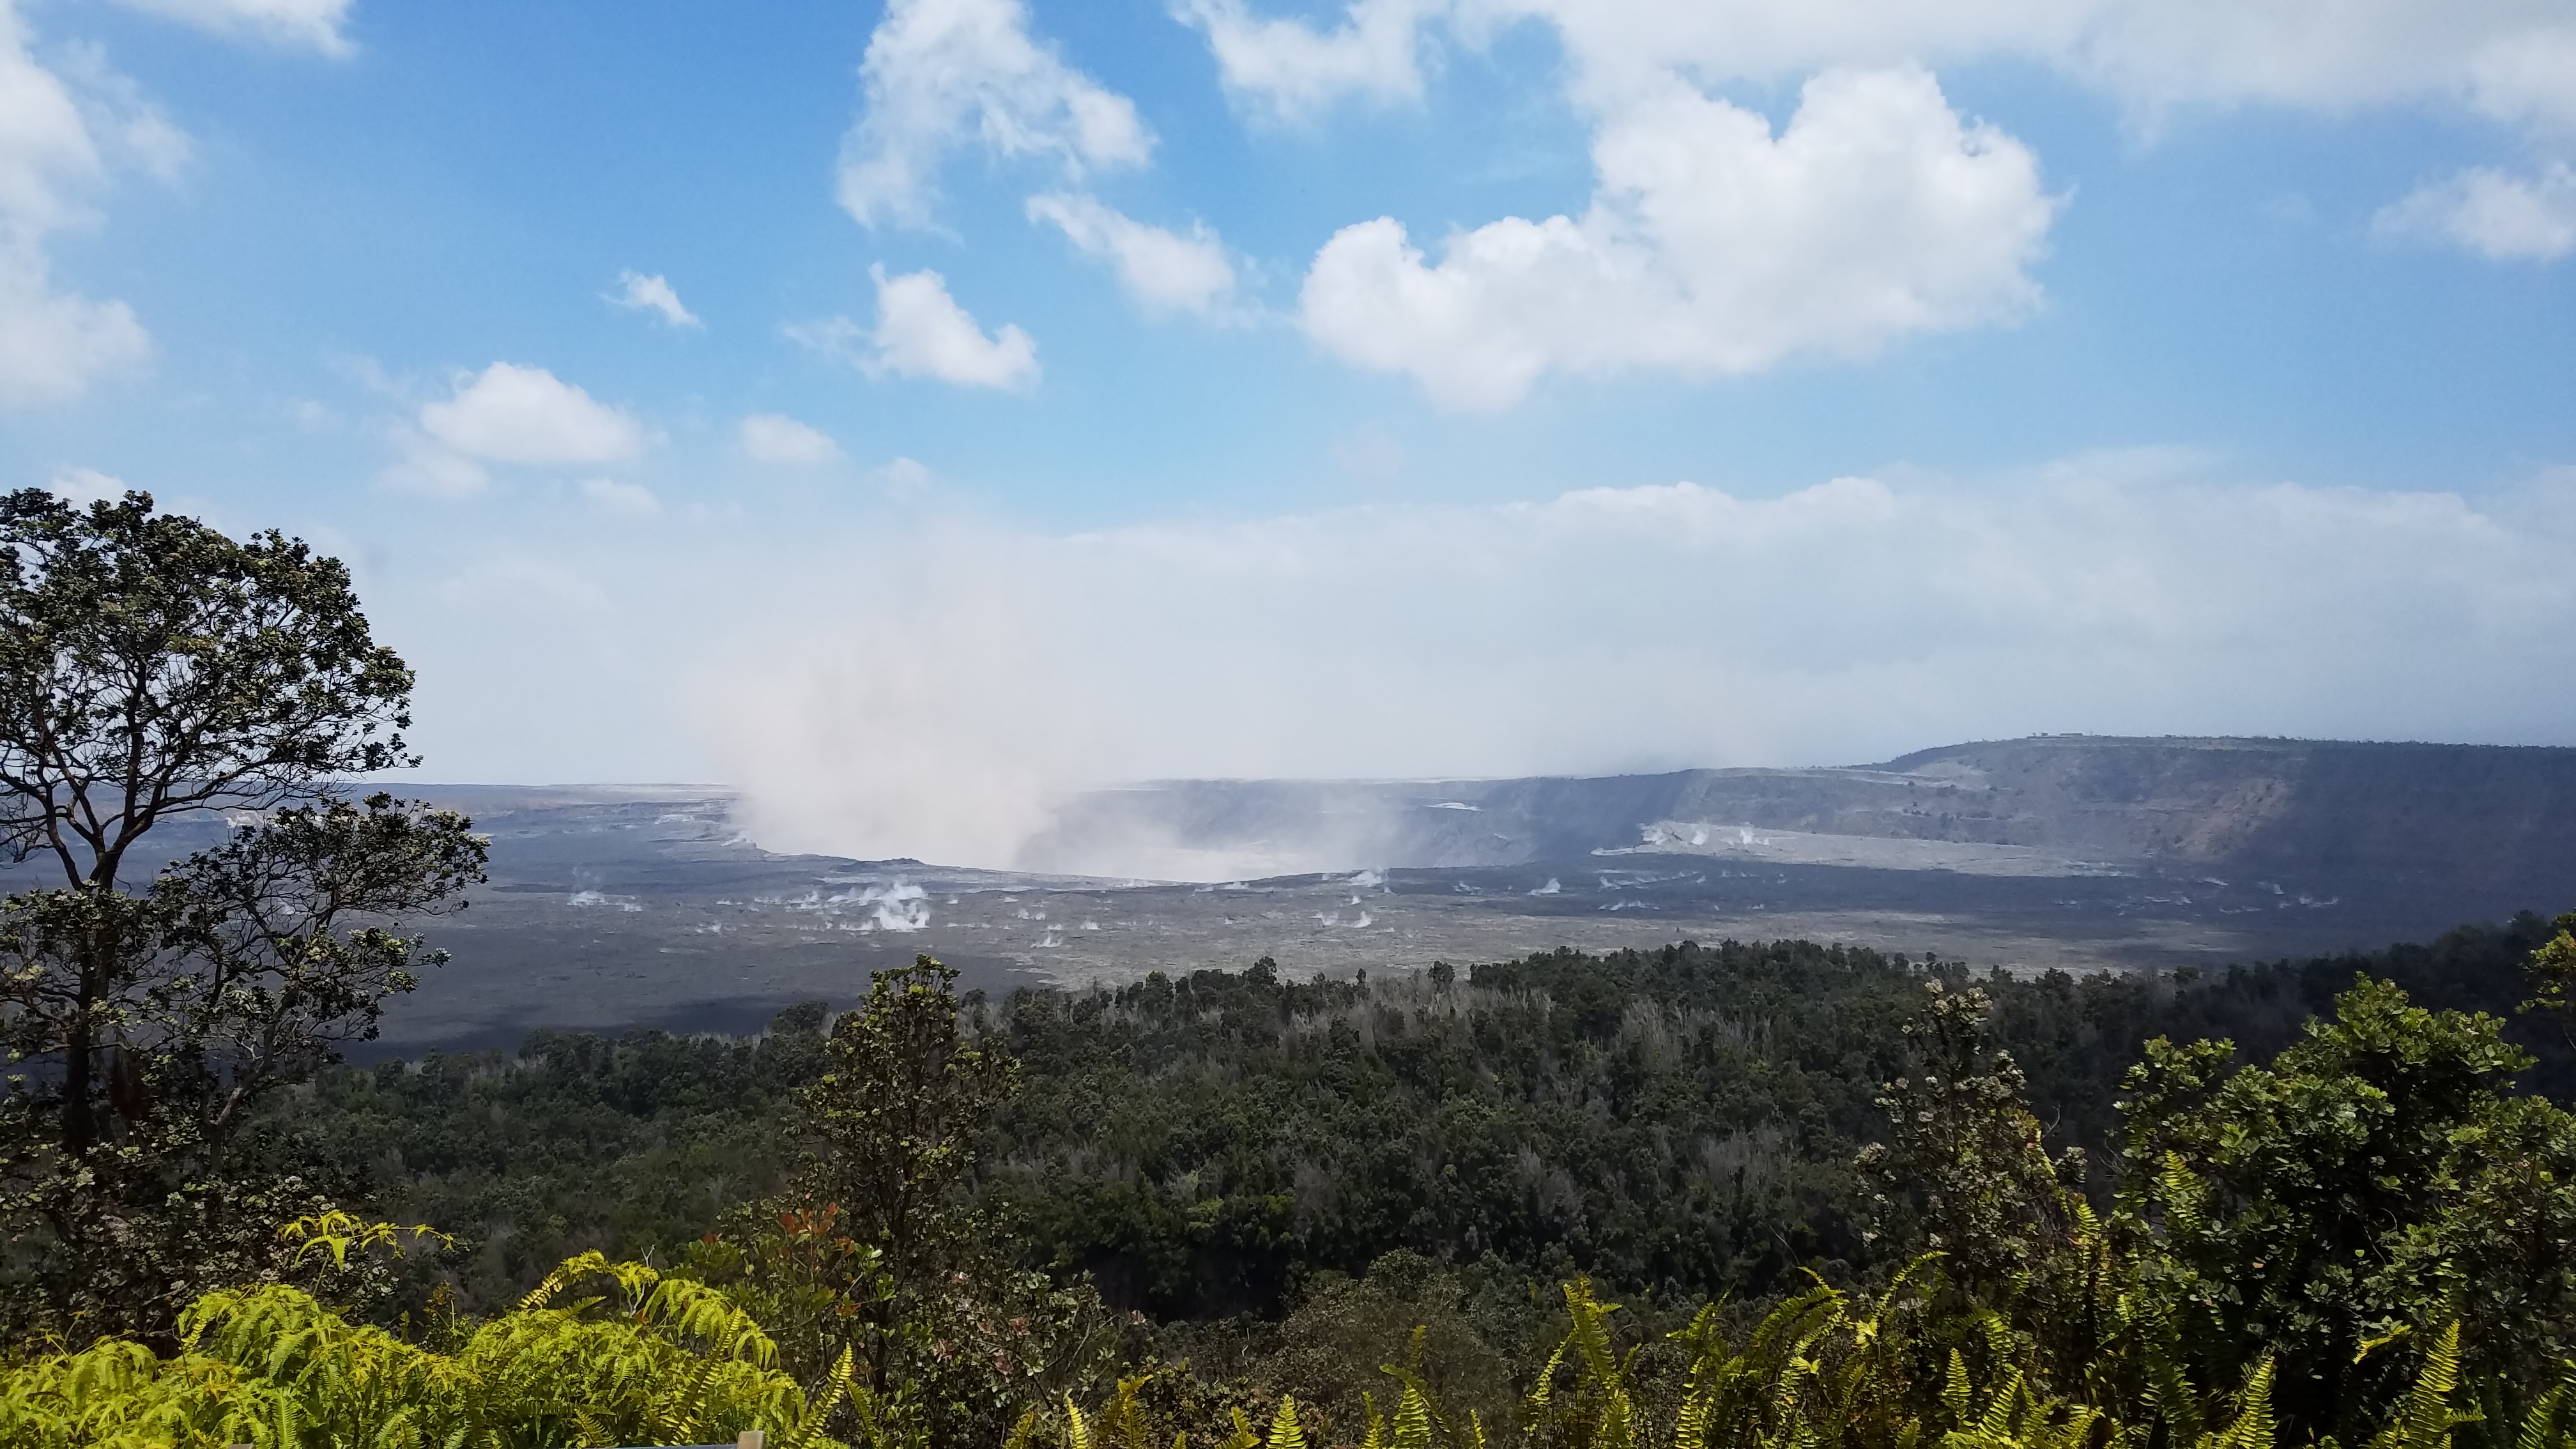
USGS: “View of Kīlauea Volcano’s summit [from Volcano House, I think]. The brown visible dust coming from Halema‘uma‘u is from rockfalls.” (Full-sized)
Kilauea’s summit is changing visibly day by day. Today’s collapse explosion came at 2:51pm, 31 hours after the previous event. Mag 5.3, as usual, with a 500-foot ash-poor plume (captured on livestream). It was somewhat obscured by dust from multiple rockfalls 3 minutes earlier. Here’s a before-and-after:
On Thursday, there was an hour and a half meeting with the USGS, National Park Service and residents of Volcano Village. Above is a video of the whole meeting. As usual, I’m interested in the geology, and so I’ve made a transcript of that part of the meeting. The first half of Kyle Anderson’s talk rehashes the “collapse/explosion” events that we’ve covered before, but the second half has a timelapse of Halema’uma’u from June 1st to June 28th — which I’ve rebuilt frame by frame, since I could just make out the timestamps— plus the latest Digital Elevation Model of Kilauea’s summit showing the slumping not only in Halema’uma’u, but across part of the caldera floor.
Scientist-in-Charge Tina Neal (HVO)
[5:40] [Introductory remarks, greetings and thanks]
[6:20] So tonight you’ll hear from familiar faces, Kyle Anderson and Don Swanson, who will give you an update on what the volcano is doing, what we think is happening, and we’ll touch on this very important question of how long and how big. Those are very hard questions to answer, so let me just preview that we’re not going to give you a wonderful take-away that will solve all that uncertainty. But we’ll do the best we can.
Fissure 8 and the summit explosions continue their status quo. However, for the last few days, the lava flow at Kapoho has been encroaching on new areas on its northern and southern boundaries at the coast.
At least 3 more Kapoho Beach Lot houses have burned on the north side, and the southern edge of the flow is burning vegetation and/or farmland west of Highway 137. I gather these new lateral outbreaks are due to the lava channel crusting over, about half a mile inland from the new coastline (see Wednesday’s thermal map). So instead of pouring straight from the channel into the ocean, lava is fanning out under the crust of the 2-mile-wide lava delta laid down earlier this month, then oozing out the sides.
[USGS drone footage of Fissure 8 from before dawn. They’re using drones for the first time to map flows, look for outbreaks and measure the lava river’s speed.]
At Kilauea’s summit, today’s collapse explosion occurred at 7:51am HST, June 29, with an ash-poor steam plume that rose 500 feet. (Steam?)The energy release dropped slightly to 5.2. I didn’t do a video capture, since the summit was blanketed in morning fog.
The “new news” today is that HVO has added two new views to its Kilauea Webcams page. One I’ve mentioned before, the old “Kilauea East” webcam from HVO’s 1990s website which has annoying reflections but a great view of the subsidence/collapse on the east side of Halema’uma’u Crater:
June 25, 2018 screengrab from “Kilauea East” webcam.
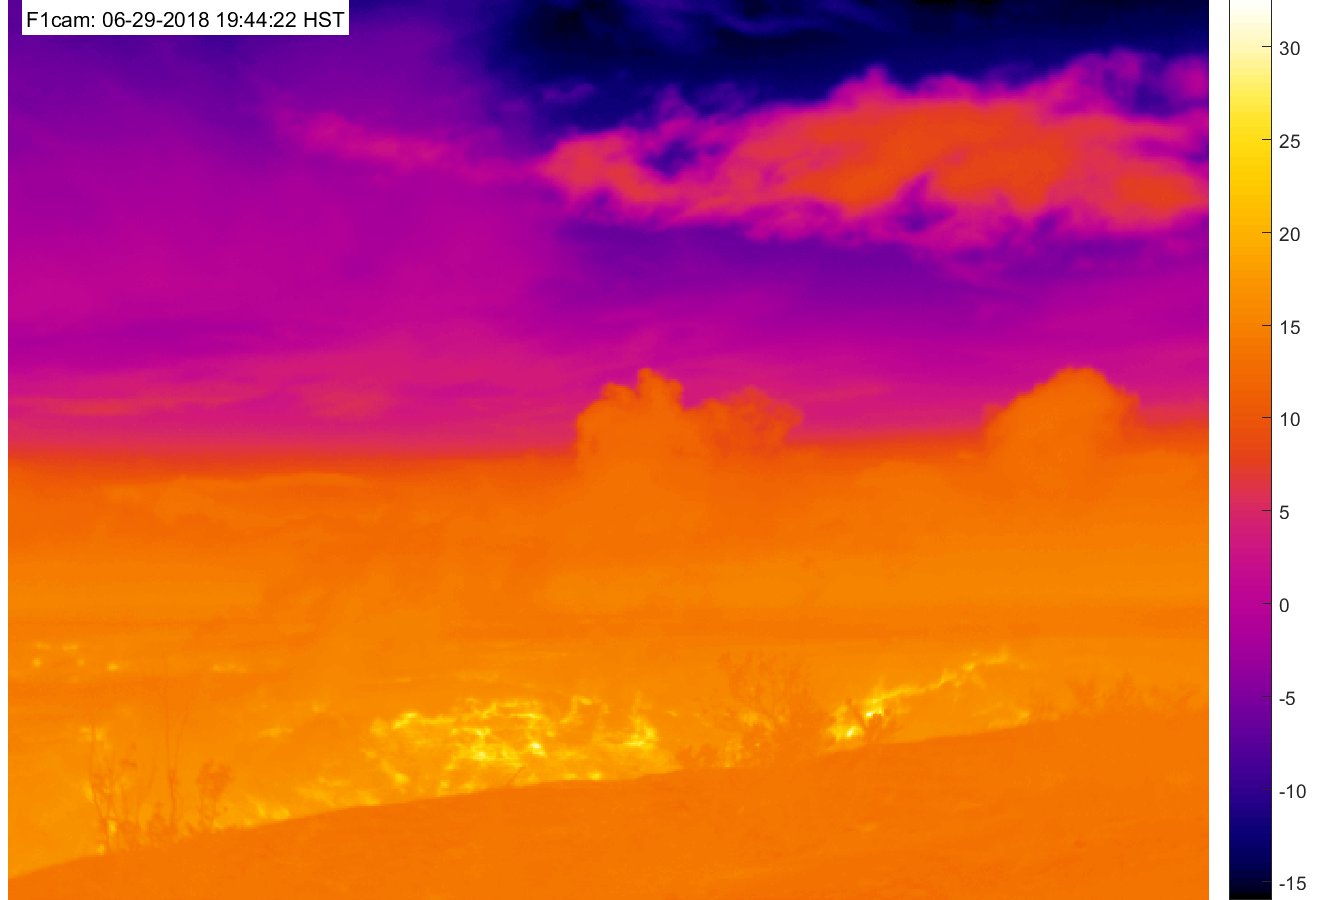
The other is a new heat-sensitive webcam which should make it possible to see “collapse explosions” at night:
Also, in this week’s “Volcano Watch” newsletter, Hawaiian Volcano Observatory scientists explain the “piston” model they’ve developed to account for the daily collapse explosions at the summit:
This is big news. They’ve solved the mystery of the summit explosions! Subject to revision, of course; they’re still untangling the complexities of Kilauea’s current eruption. But the “piston” model accounts for the cyclical pattern they’re seeing better than the “steam explosion” model.
Exactly 8 weeks after the Lower East Rift Zone eruption began in Leilani Estates on May 3, Fissure 8 continues to gush unabated. Its fountains are contained within its 55-meter (180 ft) cone, and this morning’s overflight showed no active overflows.
For the past day or so, the lava river has crusted over on the last half mile to the ocean. This has allowed lava seeps, described by Steve Brantley in his Tuesday evening talk, to creep into still-molten earlier flows on the northern side of the lava delta. This “lava seepage” is oozing into the ocean along a broad front, encroaching onto what’s left of Kapoho Beach Lots on the northern edge of the flow:
USGS: “View of the ocean entry (lower left) from this morning’s overflight. Lava was entering the ocean across a broad area primarily on the north part of the lava delta. Upslope along the northern margin of the flow field, lava is still oozing from several points in the area of Kapoho Beach Lots. Fissure 8 lava fountain in the upper left. Note southward bend in the lava channel around Kapoho Crater.” (Full-sized)
At Kilauea’s summit, the most recent collapse explosion occurred at 4:49am this morning, sending up an ash-poor plume about 1000 feet, with the energy release of a 5.3 earthquake. The sides of Halema’uma’u continue to collapse inward and downwards, especially during each explosive event.
Increased seismicity in the hours leading up to each explosion, up to 25-35 small earthquakes an hour, is wearing on the nerves of nearby Volcano Village. The USGS is meeting with them tonight to talk about the ongoing earthquakes, and released an excellent FAQ today: “Frequently Asked Questions About Kilauea Volcano’s Summit Earthquakes.”
Local News Outlets Given Brief Tour of Summit
The big news today is that the National Park Service and USGS arranged a brief escorted tour for local news media to the rim of Kilauea Caldera, which has been closed to visitors for 49 days. There was also a half hour press briefing.
So today there’s suddenly a lot more videos and views of what the caldera looks like:
In fact, I’m going to put the news media links before the science segment of today’s post. Boldfaced articles include quotes, videos, and/or photos from the media summit tour.
On June 26, 2018, Deputy Scientist-in-Chief of the Hawaii Volcano Observatory, Steve Brantley, gave a ten-minute slideshow at the Puna Community Meeting in Pahoa. Video of the meeting is posted here. Steve Brantley’s talk starts at 35:00 in that video.
BigIslandVideoNews excerpted half of his talk in this video, which they overlaid with footage from a June 24 USGS drone overflight of the summit:
Below is my transcript of the complete talk, including images that match or approximate his slides.
Steve Brantley (USGS):
Hello, everybody. Thank you for coming out.
I’ll just describe a few things occurring in the Lower East Rift Zone and then summarize the activity up at the summit at the very end.