On Thursday, there was an hour and a half meeting with the USGS, National Park Service and residents of Volcano Village. Above is a video of the whole meeting. As usual, I’m interested in the geology, and so I’ve made a transcript of that part of the meeting. The first half of Kyle Anderson’s talk rehashes the “collapse/explosion” events that we’ve covered before, but the second half has a timelapse of Halema’uma’u from June 1st to June 28th — which I’ve rebuilt frame by frame, since I could just make out the timestamps— plus the latest Digital Elevation Model of Kilauea’s summit showing the slumping not only in Halema’uma’u, but across part of the caldera floor.
Scientist-in-Charge Tina Neal (HVO)
[5:40] [Introductory remarks, greetings and thanks]
[6:20] So tonight you’ll hear from familiar faces, Kyle Anderson and Don Swanson, who will give you an update on what the volcano is doing, what we think is happening, and we’ll touch on this very important question of how long and how big. Those are very hard questions to answer, so let me just preview that we’re not going to give you a wonderful take-away that will solve all that uncertainty. But we’ll do the best we can.
And just know that we’re constantly working on those questions, and trying to get information out in a variety of ways. One of them is our venerable Volcano Watch column that goes out every week, and I’d like to call your attention to this week’s column that just went out, and was written by Brian Shiro, our seismologist. And it tries to explain something about these magnitude 5.2-5.3 repeating events that are happening every day or so. We’re also trying to push out daily information through our updates, and we’re pulling together a document that will probably be on our website in the next few days, that tries to summarize the activity at the summit and the prognosis for what’s coming. So be looking for that when it comes out on our website in the next few days, please.
[She may mean the new “Kilauea Summit Earthquakes FAQ” (PDF version) that came out the same day as this talk, or there may be something else in the works.]
So with that, let me bring up Kyle Anderson, research geophysicist, who used to work at HVO, escaped to California, but events of this magnitude have brought him back, and we’re glad to have him. He’s been working really hard on what is happening here at Kilauea.

Kyle Anderson, Seismologist
[7:50] Thanks, Tina. So I’ve been told I have 5 minutes to cover the science, so it’s going to be a little rushed, but I promise there is going to be time for questions at the end.
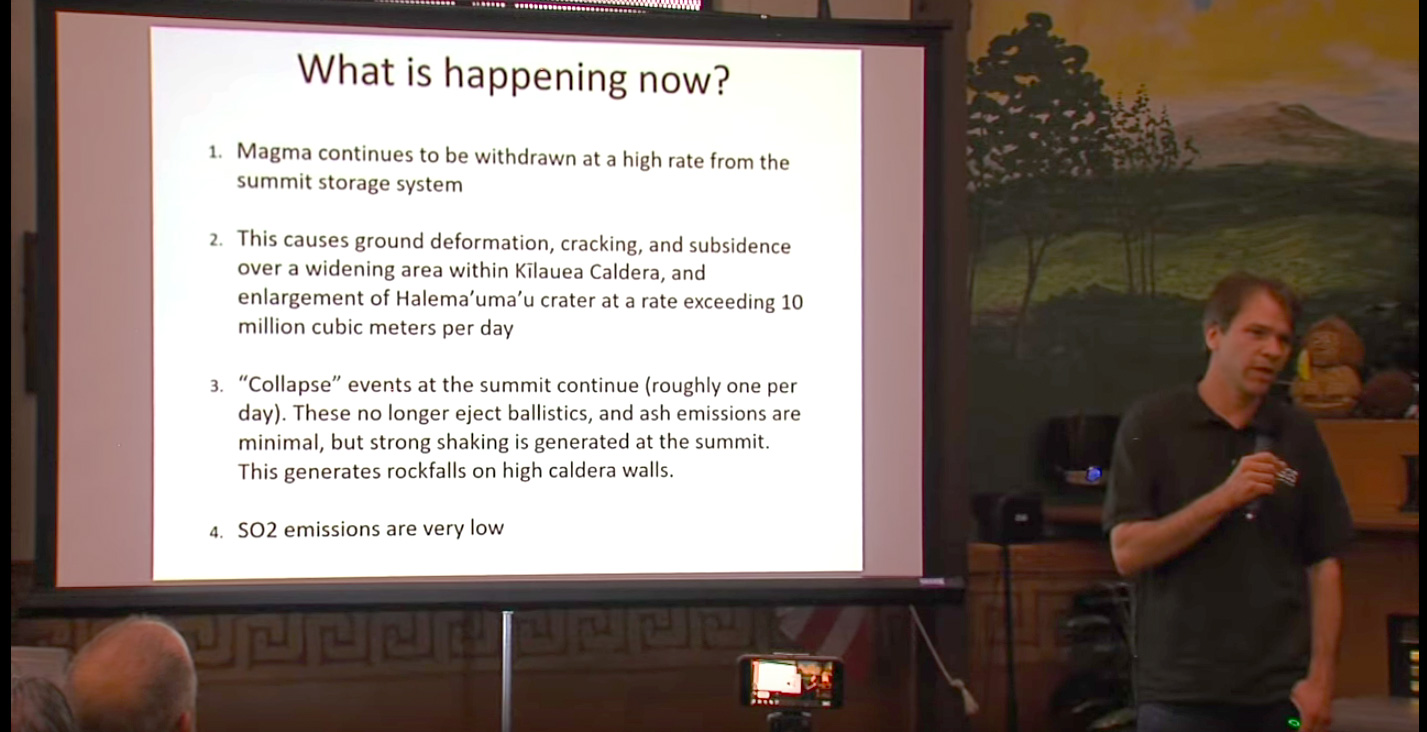
So this is maybe the most important slide that I’ll present: what is going on right now? Bottom line, four things here.
Number one, magma does continue to be withdrawn from the summit reservoir system at a high rate. This is causing ground deformation, cracking and subsidence over a wide and in fact broadening region of the caldera floor in and around Halema’uma’u.
That rate as of our most recent measurement, which was June 21st, is about 10 million cubic meters per day. And that’s a pretty enormous number, and you can go online to convert that into dump trucks/second or something, but it’s pretty huge.
Number three, “collapse” events at the summit continue. These are happening about once per day. These are the events which, earlier in the eruption, were producing ash plumes which went up to 25,000 feet and caused large earthquakes. These are no longer ejecting ballistics around the vent, and ash emissions at this point are really minimal.
But the seismicity continues. And by some metrics it may even have increased and been more readily felt recently. These earthquakes are generating shaking which is damaging facilities in the area and producing rockfalls on caldera walls, etc. So, less material being erupted into the atmosphere, very little in fact, but the seismic shaking, of course, continues.
And finally, SO2 emissions are very low. That’s good news.
So, I showed a plot like this three weeks ago when I was here before. This is a measurement of ground deformation as recorded by an instrument located near the Jaggar Museum. This is ground tilt, but you can really think of it as a proxy for inflation and deflation of the magma reservoir.
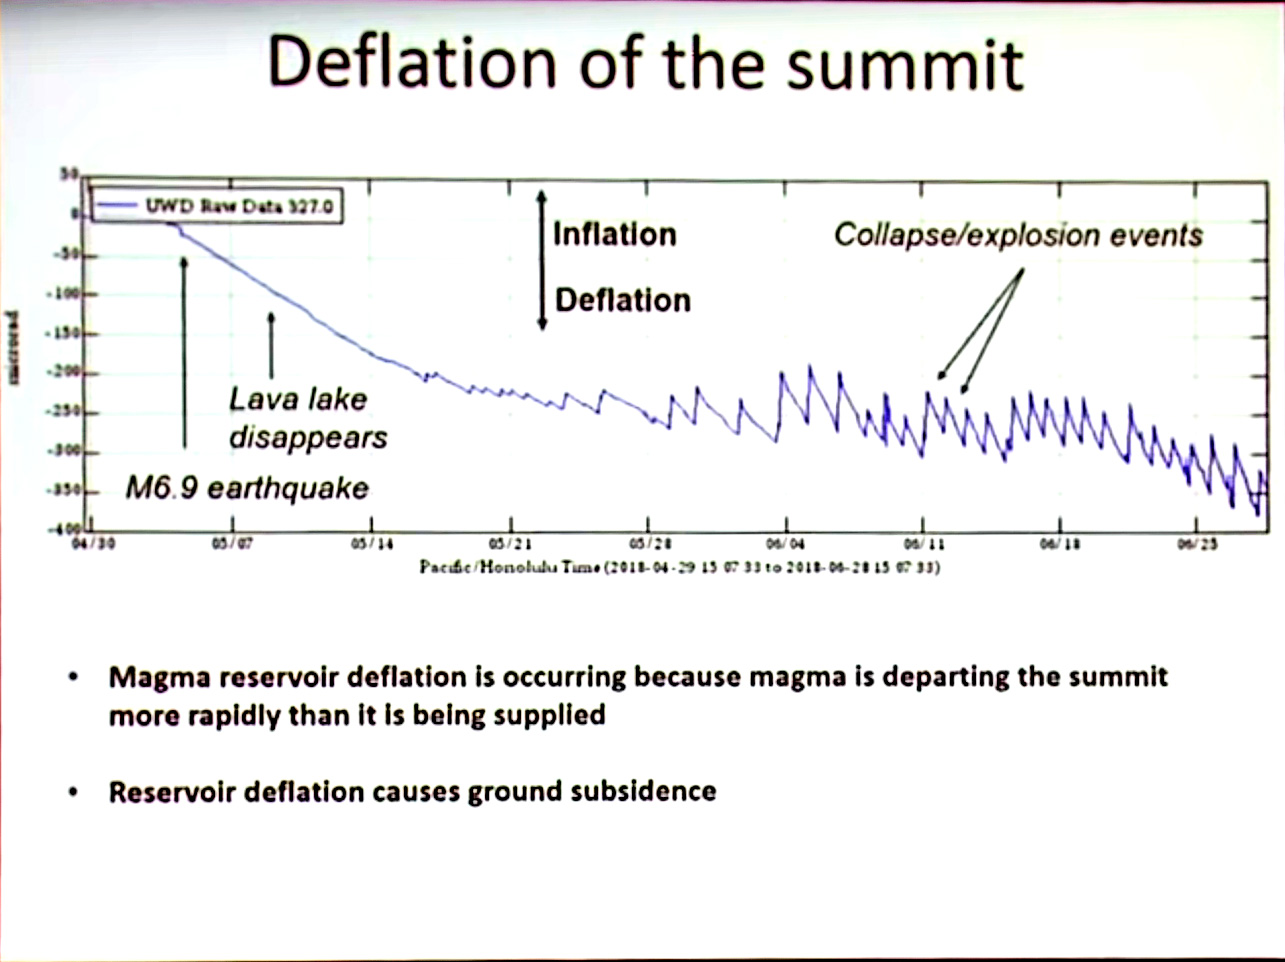
So the horizontal axis here is time that goes from April 30 up until the present. And when that blue line goes up, that means that the reservoir is inflating. When it goes down, it means that the reservoir is deflating.
So, earlier in that time series was the magnitude 6.9 earthquake. The lava lake disappeared around May 10. The reservoir continued to deflate. Explosions started happening at the summit in mid-May.
As time has gone on, each of these offsets here, these vertical peaks, represents one of these collapse/explosion events. These are the ones, again, which were previously ejecting plumes into the atmosphere and are not doing so much any more.
We now believe that each of these events is caused by material— rock— in the caldera slumping inwards and downwards, inwards and towards the magma reservoir.
So what’s happening is material is being withdrawn from that reservoir at a high rate— that’s magma that’s exiting the summit storage system, and it’s going down towards the East Rift Zone. That’s creating a low-pressure zone or you can think of it as void space, although it’s not that simple. Rock is then slumping downwards to fill the space evacuated by magma as it goes down to the rift zone.
So if we zoom in on the tilt at the end [of the graph] here…[points]
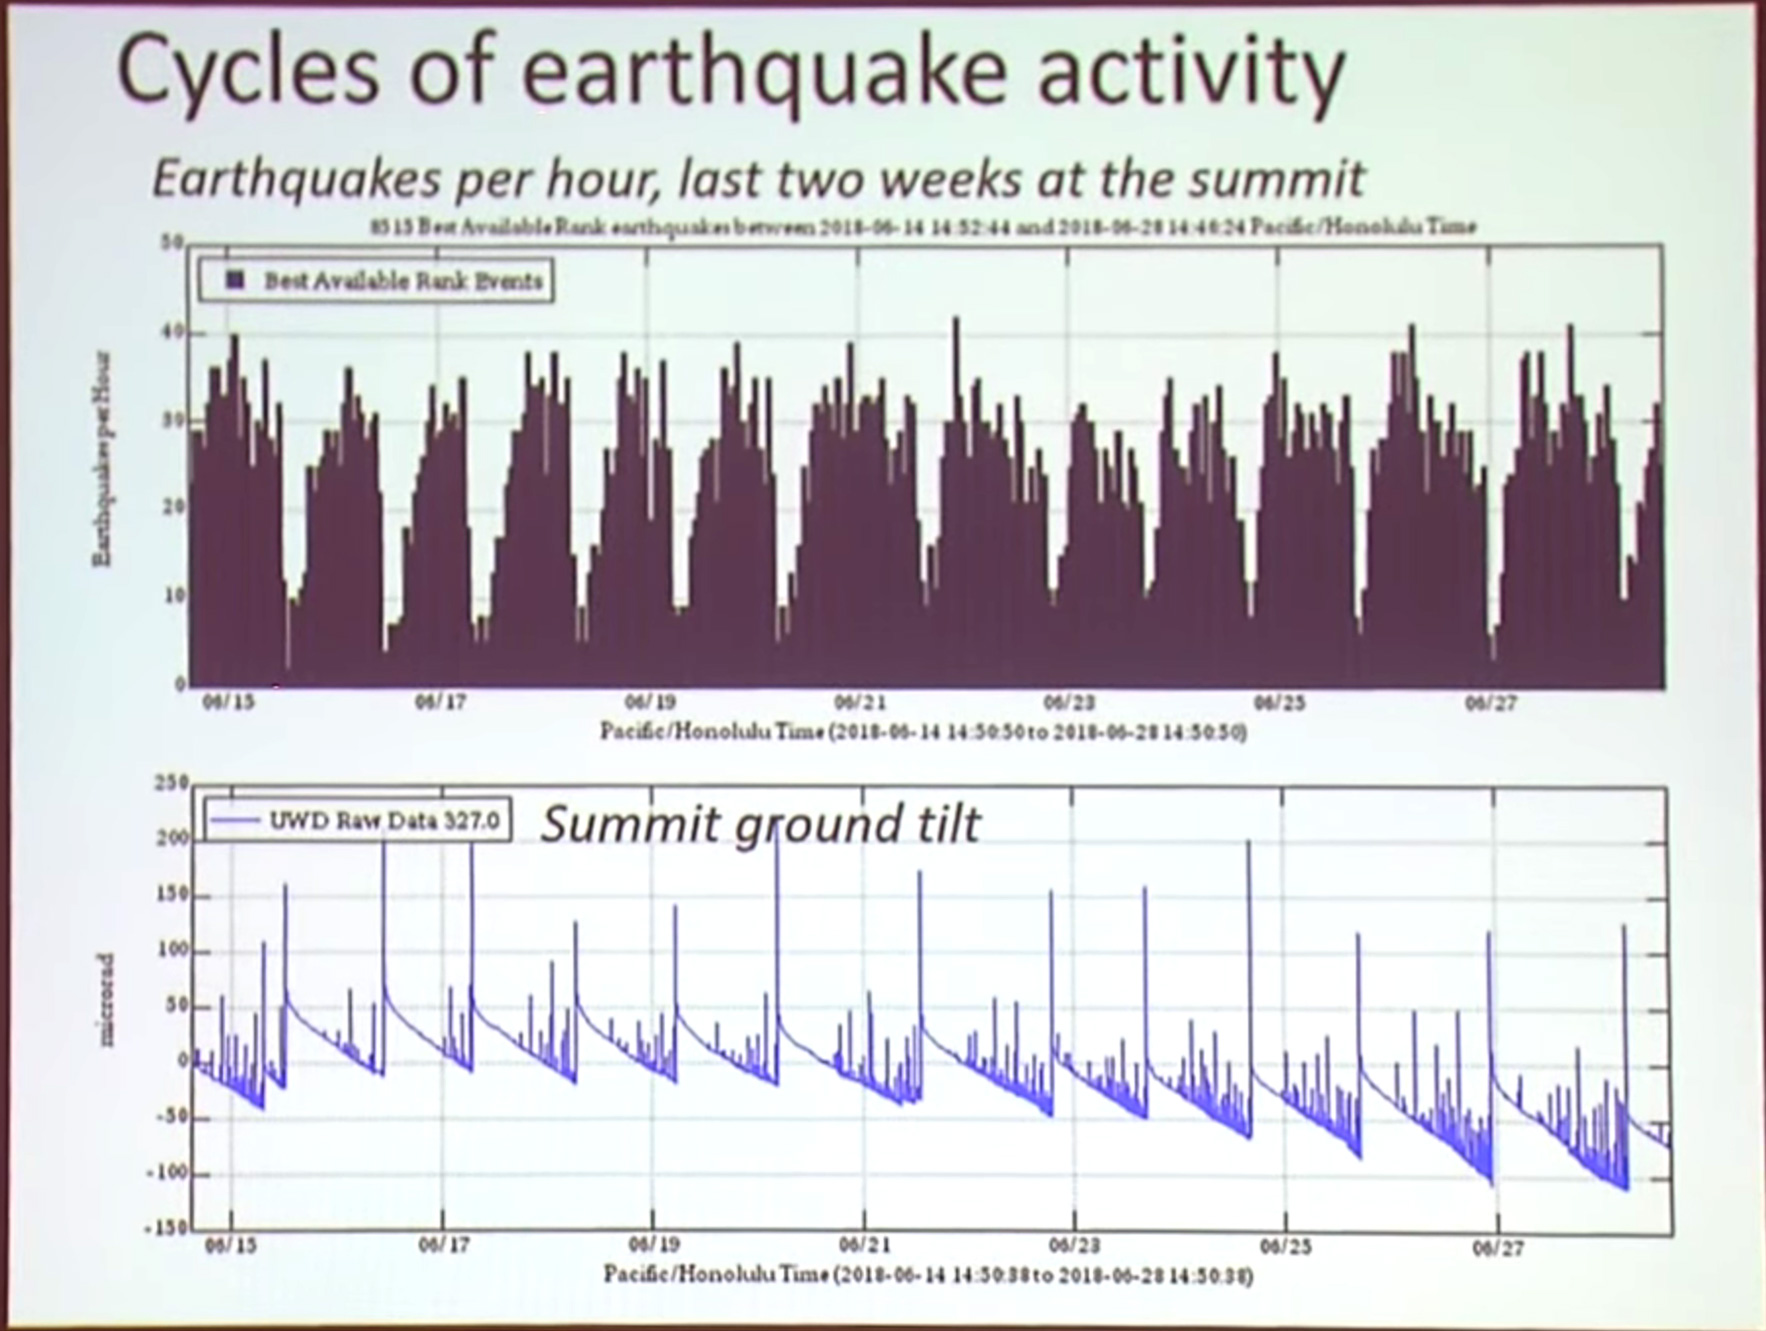
So this is ground deformation, the bottom is just an enlargement of that, going back to, I think, June 15. Here we can see that the ground deformation, again, is very cyclical, and as a result, so are the earthquakes.
So the top plot is earthquakes per hour as a function of time. And the lines are not so clear here. But what you can see is that whenever one of these collapse events happen— and you all know this, you who live up here— the earthquake activity drops off dramatically, and then it picks up gradually. [He pointed to one of the blue “spikes,” the line sticking up, and the dip in earthquake frequency on the chart above it.] And then we have a large seismic event, and then it drops again. And that cycle has repeated remarkably regularly, about every 24 hours for the last couple of weeks.
And again, we think that’s caused by slumping of material inwards and downwards towards the magma reservoir. So stress is building up, earthquakes are increasing, that slumping event happens, you get a large earthquake, and the cycle repeats itself.

[11:45] This is a Digital Elevation Model. It’s a topographic map of the summit. The left is 2009, and the right is June 21, 2018. That’s our most recent data. These are generated by UAV flights conducted at the summit with the permission of the park.

So you can see on the left is the familiar Halema’uma’u and the lava lake as it was just starting to form in 2009. And the right is what it looks like more or less now. So, enormous changes. That’s a volume change of about 300 million cubic meters, as of June 21. The bottom of the crater is deepening with time. It’s now about 680 meters above sea level. Maybe that doesn’t mean a whole lot, but it’s a little over 1,000 feet deeper than the old crater floor. So it’s very deep. By some metrics, it’s probably doubled in diameter.

This is an aerial photograph on June 18, actually, of Halema’uma’u, and it’s really unrecognizable, I think, in many ways. This is actually a composition of two photos, because it’s so large, that you can’t in fact fit it in one in a normal camera lens.
So you can see some benches in there. This one in the center here is the old Halema’uma’u crater floor which has subsided in these episodic slumping events. Here on the top, we have old caldera floor which has partially slumped down towards the crater. And then in the lower left-hand side there, you can see a bunch of dark lines. That is all cracking which is extending further and further outwards from Halema’uma’u towards the center of the caldera.

[13:20] This is actually an animation. This a photograph— one photograph taken between every one of these collapse/explosion events. And so, we start— this’ll start over in a minute here I think— we start with a photograph from early May. That’s what the summit used to look like. And as we go through, keep your eye on this side of the crater [points to the far right]. And you can see subsidence happening. This material drops really out of sight.
This a camera located at the Hawaiian Volcano Observatory.
And as it starts again, maybe keep your eye on the lefthand side. You can see the same thing happens over there.
Most of this downdropping and slumping is happening during these larger events that are about once per day. So this is why the crater’s becoming so much larger.

This figure is a little bit maybe more complicated to understand, but the background is again the Digital Elevation Model. So this is a topographic map of the summit. The crater is located of course over here (gray area on left). The colors represent the elevation change from this elevation model to 2009. So these purple-red colors represent more deformation— that’s about 50 meters— and then graying off to the lighter colors here, which have less deformation.
The point here is to show what’s happening now in terms of slumping. So as these slumping events continue, the diameter of Halema’uma’u is increasing. Early in this activity, earlier in May, that was predominantly on the west and southwest side of the crater. It then moved a little bit to the north. And these darker colors show that now it’s really extending more to the east and really quite a broad distance across the caldera.
The yellow dots [which look green!] are earthquakes, actually, and they give us some idea of where some of that stress is being concentrated. And then finally the numbers show the amount of downdropping at different points in the caldera. The largest that we’ve measured is more than 300 feet, just to the north of Halema’uma’u. That’s 300+, because that instrument is no longer operating. So we don’t know actually how much it’s subsided. But then as you get further northeast in the caldera, it becomes a little bit more reasonable at 28 feet.
But the bottom line is that region of highly-deforming rock in the caldera is extending outwards and broadening the diameter of Halema’uma’u as a function of time.
And with that I’m going to turn the floor over to Don Swanson. Don is a geologist at HVO. I think he probably needs no introduction. But Don has spent more time viewing this eruption from the summit than anyone else, and he has some really neat photographs to show us.
[To Be Continued]
Here’s Part 2, Don Swanson’s talk plus Q&As (Part 3) with some of the senior geologists at HVO!