On Tuesday, June 19, there was a Puna Community Meeting at Pahoa High School at 5pm. As usual, Steve Brantley of the Hawaiian Volcano Observatory/USGS gave an excellent slide presentation reviewing the current state of the Kilauea eruiption. He covered the “perched lava flow” in the Lower Rift Zone and the dramatic changes at the summit, placing each in context with previous similar events. (I didn’t realize there were records of many past Halema’uma’u collapses).
Video of the entire meeting is posted here. The USGS talk starts at 42:40. I’ve transcribed it below, adding photos when I have something close (and restoring his graphs/diagrams which don’t come through very well on video recording).
Steve Brantley, HVO/USGS:
[42:40] Okay, hello, everybody. We have a new projector. I’m hoping that it’s a brighter bulb so you can actually see the images that I selected for this evening.
I spent a 10-hour shift at the EOC with Tal and his colleagues and many others in the room here. And that was a good thing, becuase Chopper 1 did an overflight this morning of the Lower East Rift Zone, and I was able to use their photographs— thank you to the fire department for letting me use the photos that I’m going to show you tonight.
And after showing a few things about the Lower East Rift Zone, I’m going to try to go back up to the summit and give you a sense of the scale of things happening up there, which is truly astounding.

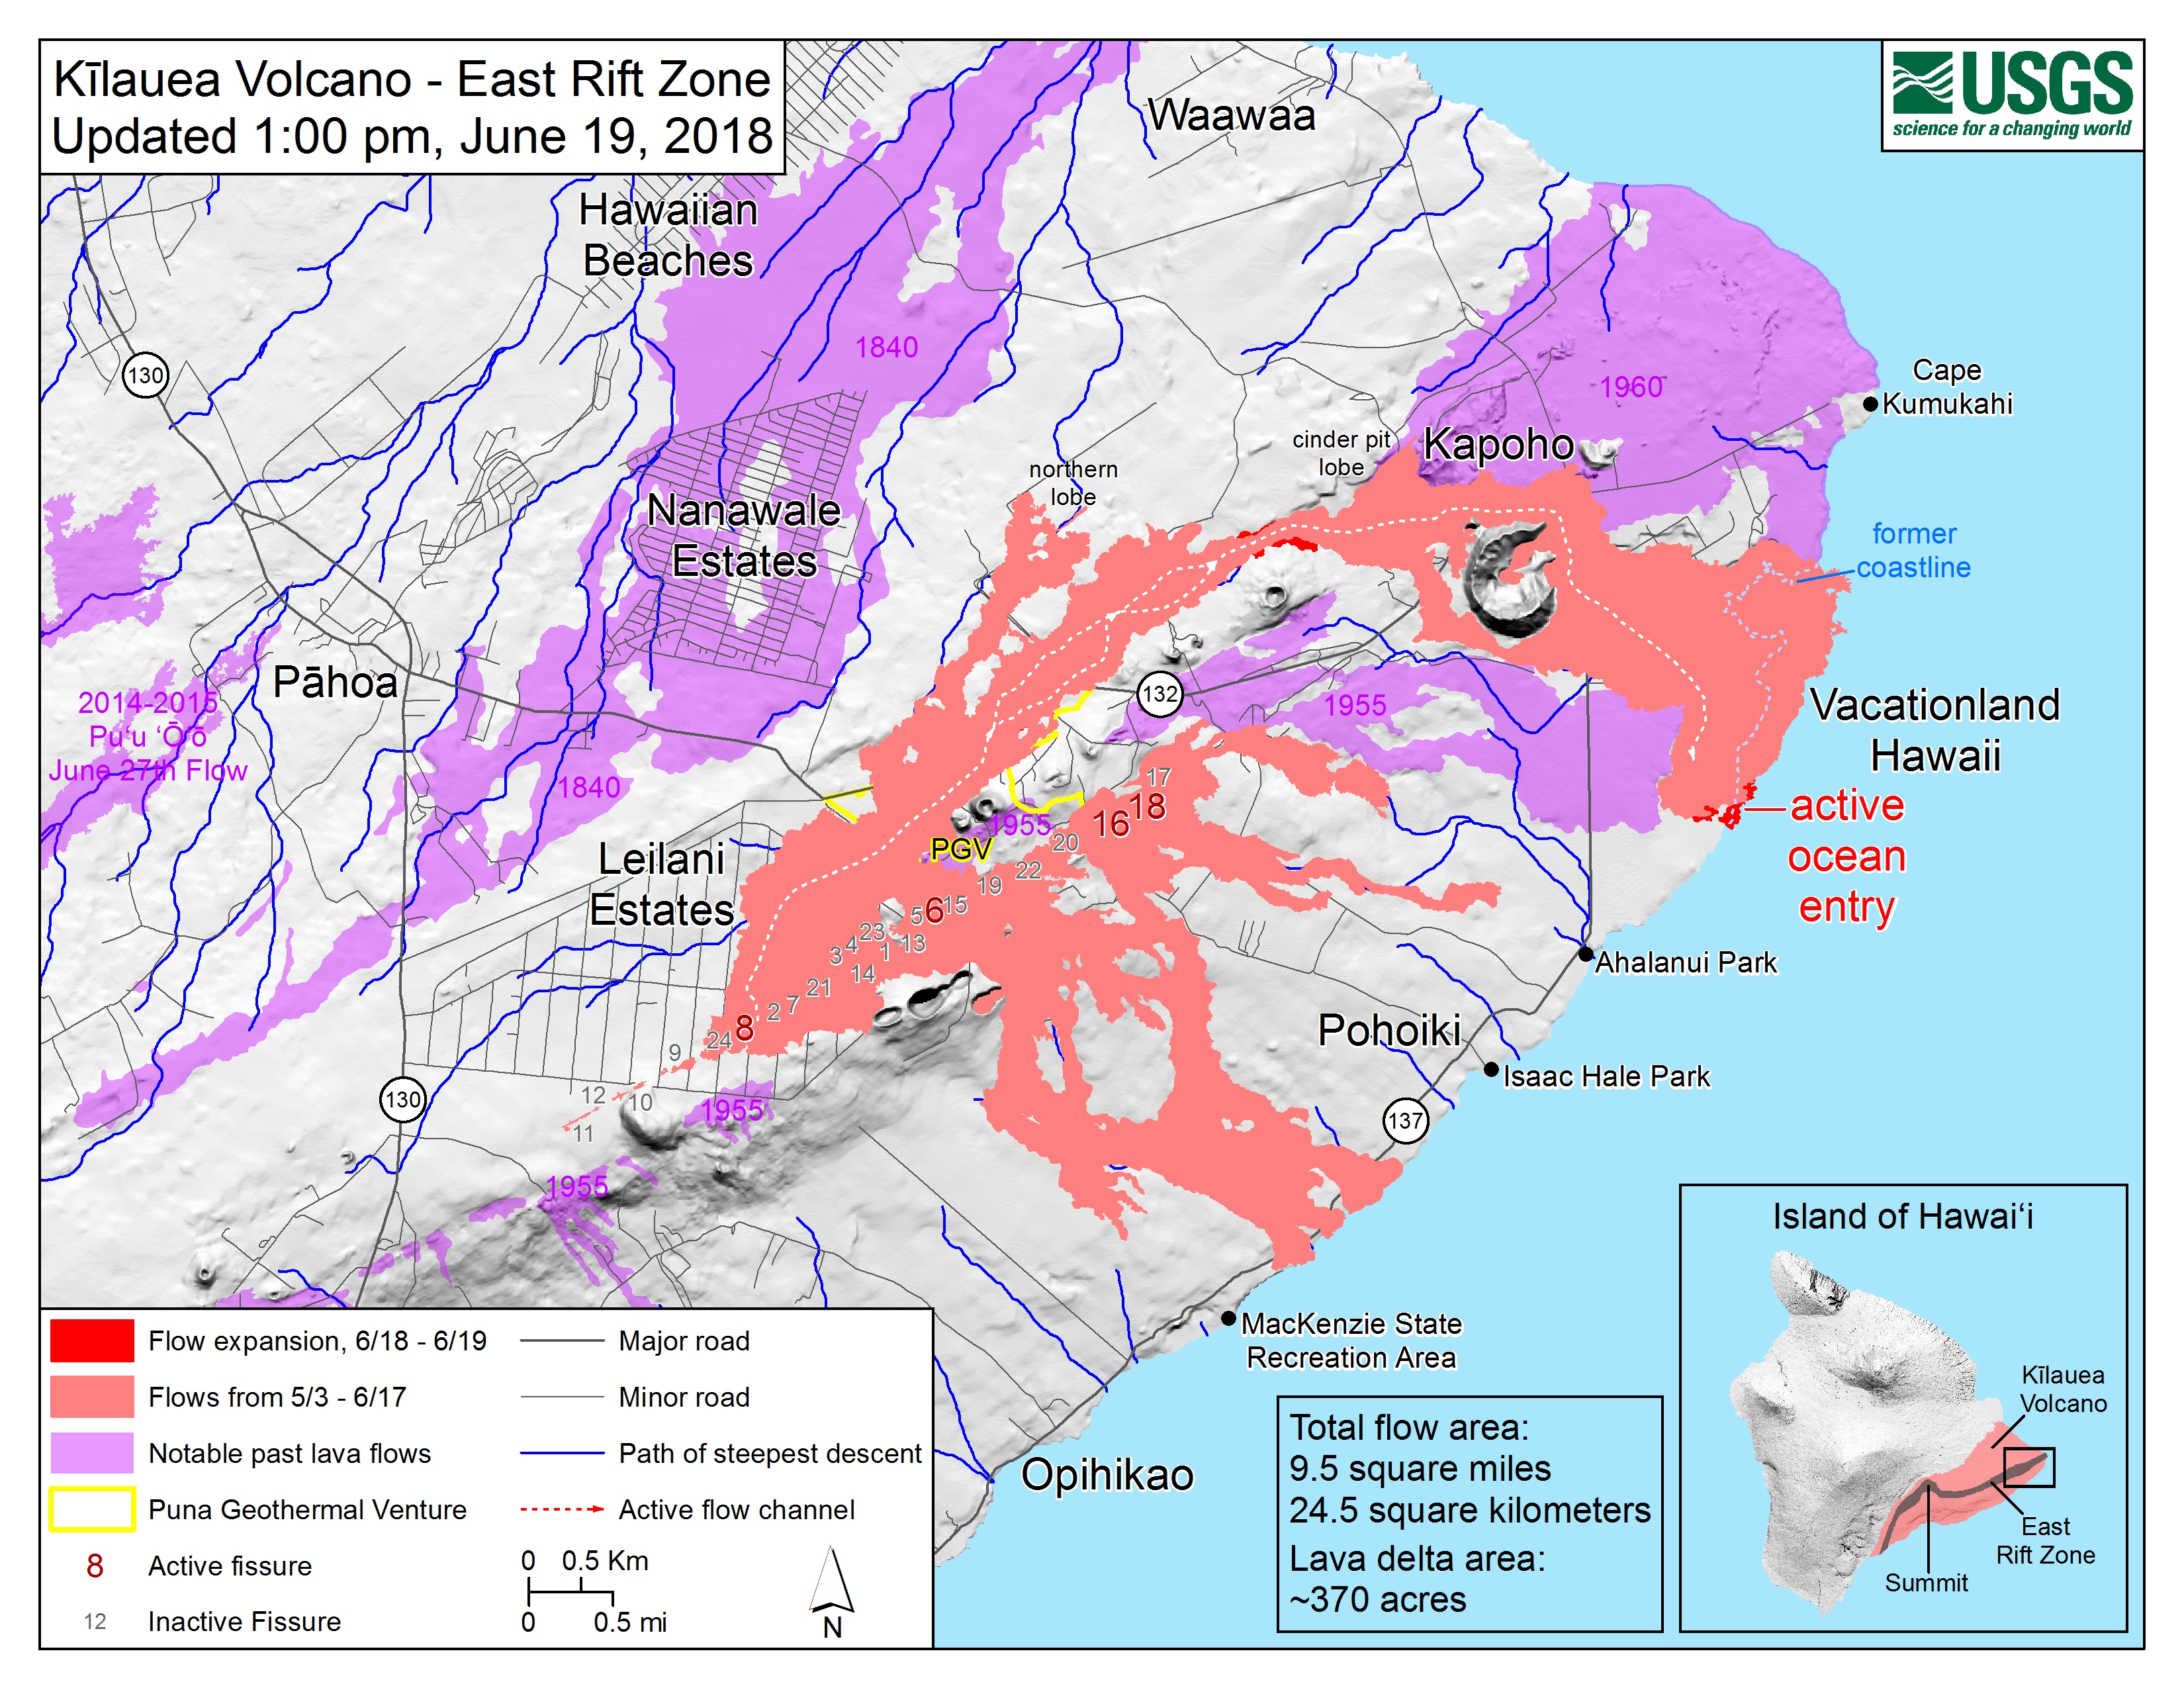
OK. So in the past week, there has been very little change occurring to the amount of lava, to the eruption rate, the amount of lava coming out of fissure 8 and pouring into the open channel. The cone has grown a little bit as the lava fountains hurl bits of lava over the rim and enlarge the crater a little bit in width and also in height.
The lava channel that’s coming out of the Fissure 8 is becoming higher and higher and higher above the ground. It’s not a dramatic rate of increase in elevation, but over the past month, that channel has become perched on the order of 50-60 feet above the surrounding ground. So each of the little overflows that happen as the channel becomes full, a little bit of lava dribbles over the edge. That serves to raise the channel. And so by that way the channel becomes more elevated above the surrounding ground.

This morning [June 19] there was one of the more vigorous overflows, that occurred just adjacent to Pohoiki Rd. I’ll point it out. It’s this little flow right here. [Slide is basically same view as above but a little later; those two overflows at left have merged and flowed all the way down to the original ground and are edging onto the vegetation.] You’ll notice it’s extended just a few meters beyond the edge of the lava flow.
So while it looked like maybe it was going to spread further, and maybe even hit 132, these overflows are really pretty passive. They’re short-lived, lasting a few hours, and so far haven’t traveled very far beyond— if at all— beyond the edge of the original lava flow.

So this is just a closer-up view of that particular overflow. As I said, as these overflows happen, it tends to raise the channel over time so it becomes perched above the surrounding ground. And so the longer-term concern is if that channel, or the levees on the channel, maybe fail a little bit, or a section fails, that becomes an exit point for that lava that’s all elevated now above the surrounding ground.
So this is just something that we try to keep an eye on every time we do an overflight as well as Chopper 1 in the Fire Department when they do their overflights, and also when we have our drone crews out there overnight, and during the day, to try to keep an eye on that levee system along the length of the channel.

There is an open channel now all the way to the ocean. And this is an area right by Kapoho Crater, which is right here [slide is slightly closer view of above; Kapoho Crater on right.] This is where Green Lake used to be.
So this is the open channel [runs pointer along channel above] that wanders, takes a righthand turn, comes down through here. And then today the lava channel split, and there were two lava entries early this morning. [Back down to one the following day, June 20].
[Slide shows bullet list:]
- 1955: 88 days, 81mcm
- 1960: 37 days, 122 mcm
- 2018: 47 days, 145 mcm
(preliminary estimate; this will change!!)
So just a bit of perspective. When we first met together in early May, right after the first eruption sequence, we suggested that the 1955 and 1960 might be an appropriate model for what we might expect over time.

So the 1955 eruption lasted about—what was it [looks over shoulder]— 88 days, and it erupted about 81 million cubic meters.
The numbers… [waves hands vaguely] aren’t so important, but it’s the relative numbers that I’m trying to point out here.
In 1960, that eruption lasted about 37 days, and erupted at a higher rate, and erupted about 122 million cubic meters.
So here we are in 2018. We’re into the eruption about 47 days, if my math is right, and then we’ve estimated how much lava has been erupted. It’s a very difficult number to come up with, but over the weekend, someone did a little bit of extra work to try to come up with a number, and that is about 145 million cubic meters.
Just keep in mind that number is going to change as people go back and look at aerial photographs in detail and satellite imagery, and create the Digital Elevation Models from the drone footage and so on. But it gives you a ballpark that this current eruption is erupting lava at a higher rate than both of those eruptions. And at this point, it doesn’t look like it’s slowing down whatsoever.
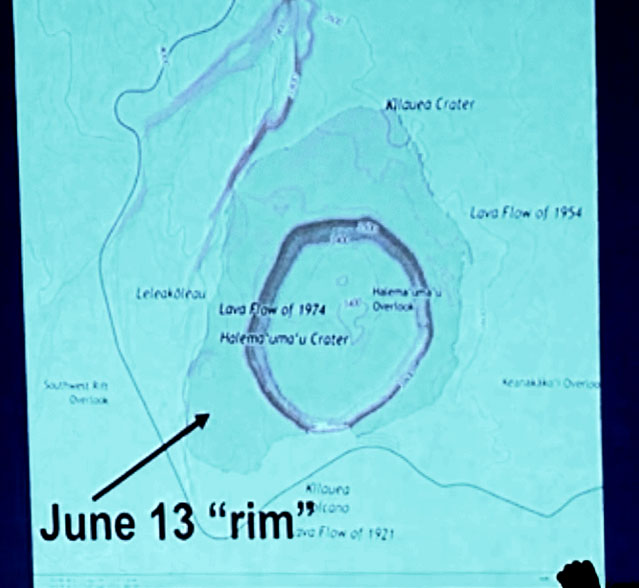
OK, let’s go up to the summit of the volcano. This is a topographic map. And the little circle here is Halema’uma’u.
The original crater before all of this started is this circle right here [runs pointer around rim of crater on slide]. It’s on the order of about half a mile in diameter in both directions, and a few hundred feet deep, a couple hundred feet deep.
The shaded area is the extent of the new Halema’uma’u crater rim as of June 13. So this is five days ago. And that rim has even enlarged further, especially to the north and a little bit off to the east.
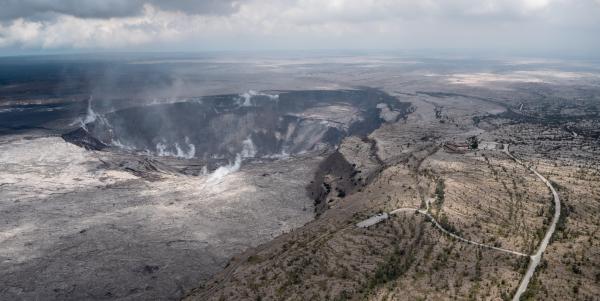
If we take a look at some photographs of what that current crater looks like— I’ll show you next. I’m going to show you an image from back over this direction from a helicopter looking this way [laser pointer at top of screen moving down and angled a tiny bit to the left over the crater, aiming just west of due south]. And you’re going to be able to see the Hawaiian Volcano Observatory for scale.
This is what Halema’uma’u looks like as of yesterday. Here is the Hawaiian Volcano Observatory and the National Park Service Jaggar Museum [farther parking lot plus buildings at end of road, middle right of image]. How many of you looked over at Halema’uma’u over the past several years with the active lava lake? [raises hand] Okay.
Halema’uma’u looks very, very, very different right now. It’s much deeper. It’s probably on the order of a thousand feet or so deep. And depending on what [horizontal] direction you measure it in, it’s probably easily doubled in size.
The features that you see like this little step here [indicates large back ledge that looks like seat] used to be right up at the top of the crater rim. So that section has slid down as the crater became deeper. And that is happening all around the crater [circles walls with laser pointer]. This area here [indicates concentric cracks on rim of crater closest to us] used to be at the same elevation back here [indicates foreground]. So that area has slumped down over 90 meters since this all started. So almost 300 feet just in that one platform has dropped.
And the dropping seems to occur primarily during those earthquake events, or those explosive events that now seem to be occurring about every 20 hours, 24 hours or so up at the summit.

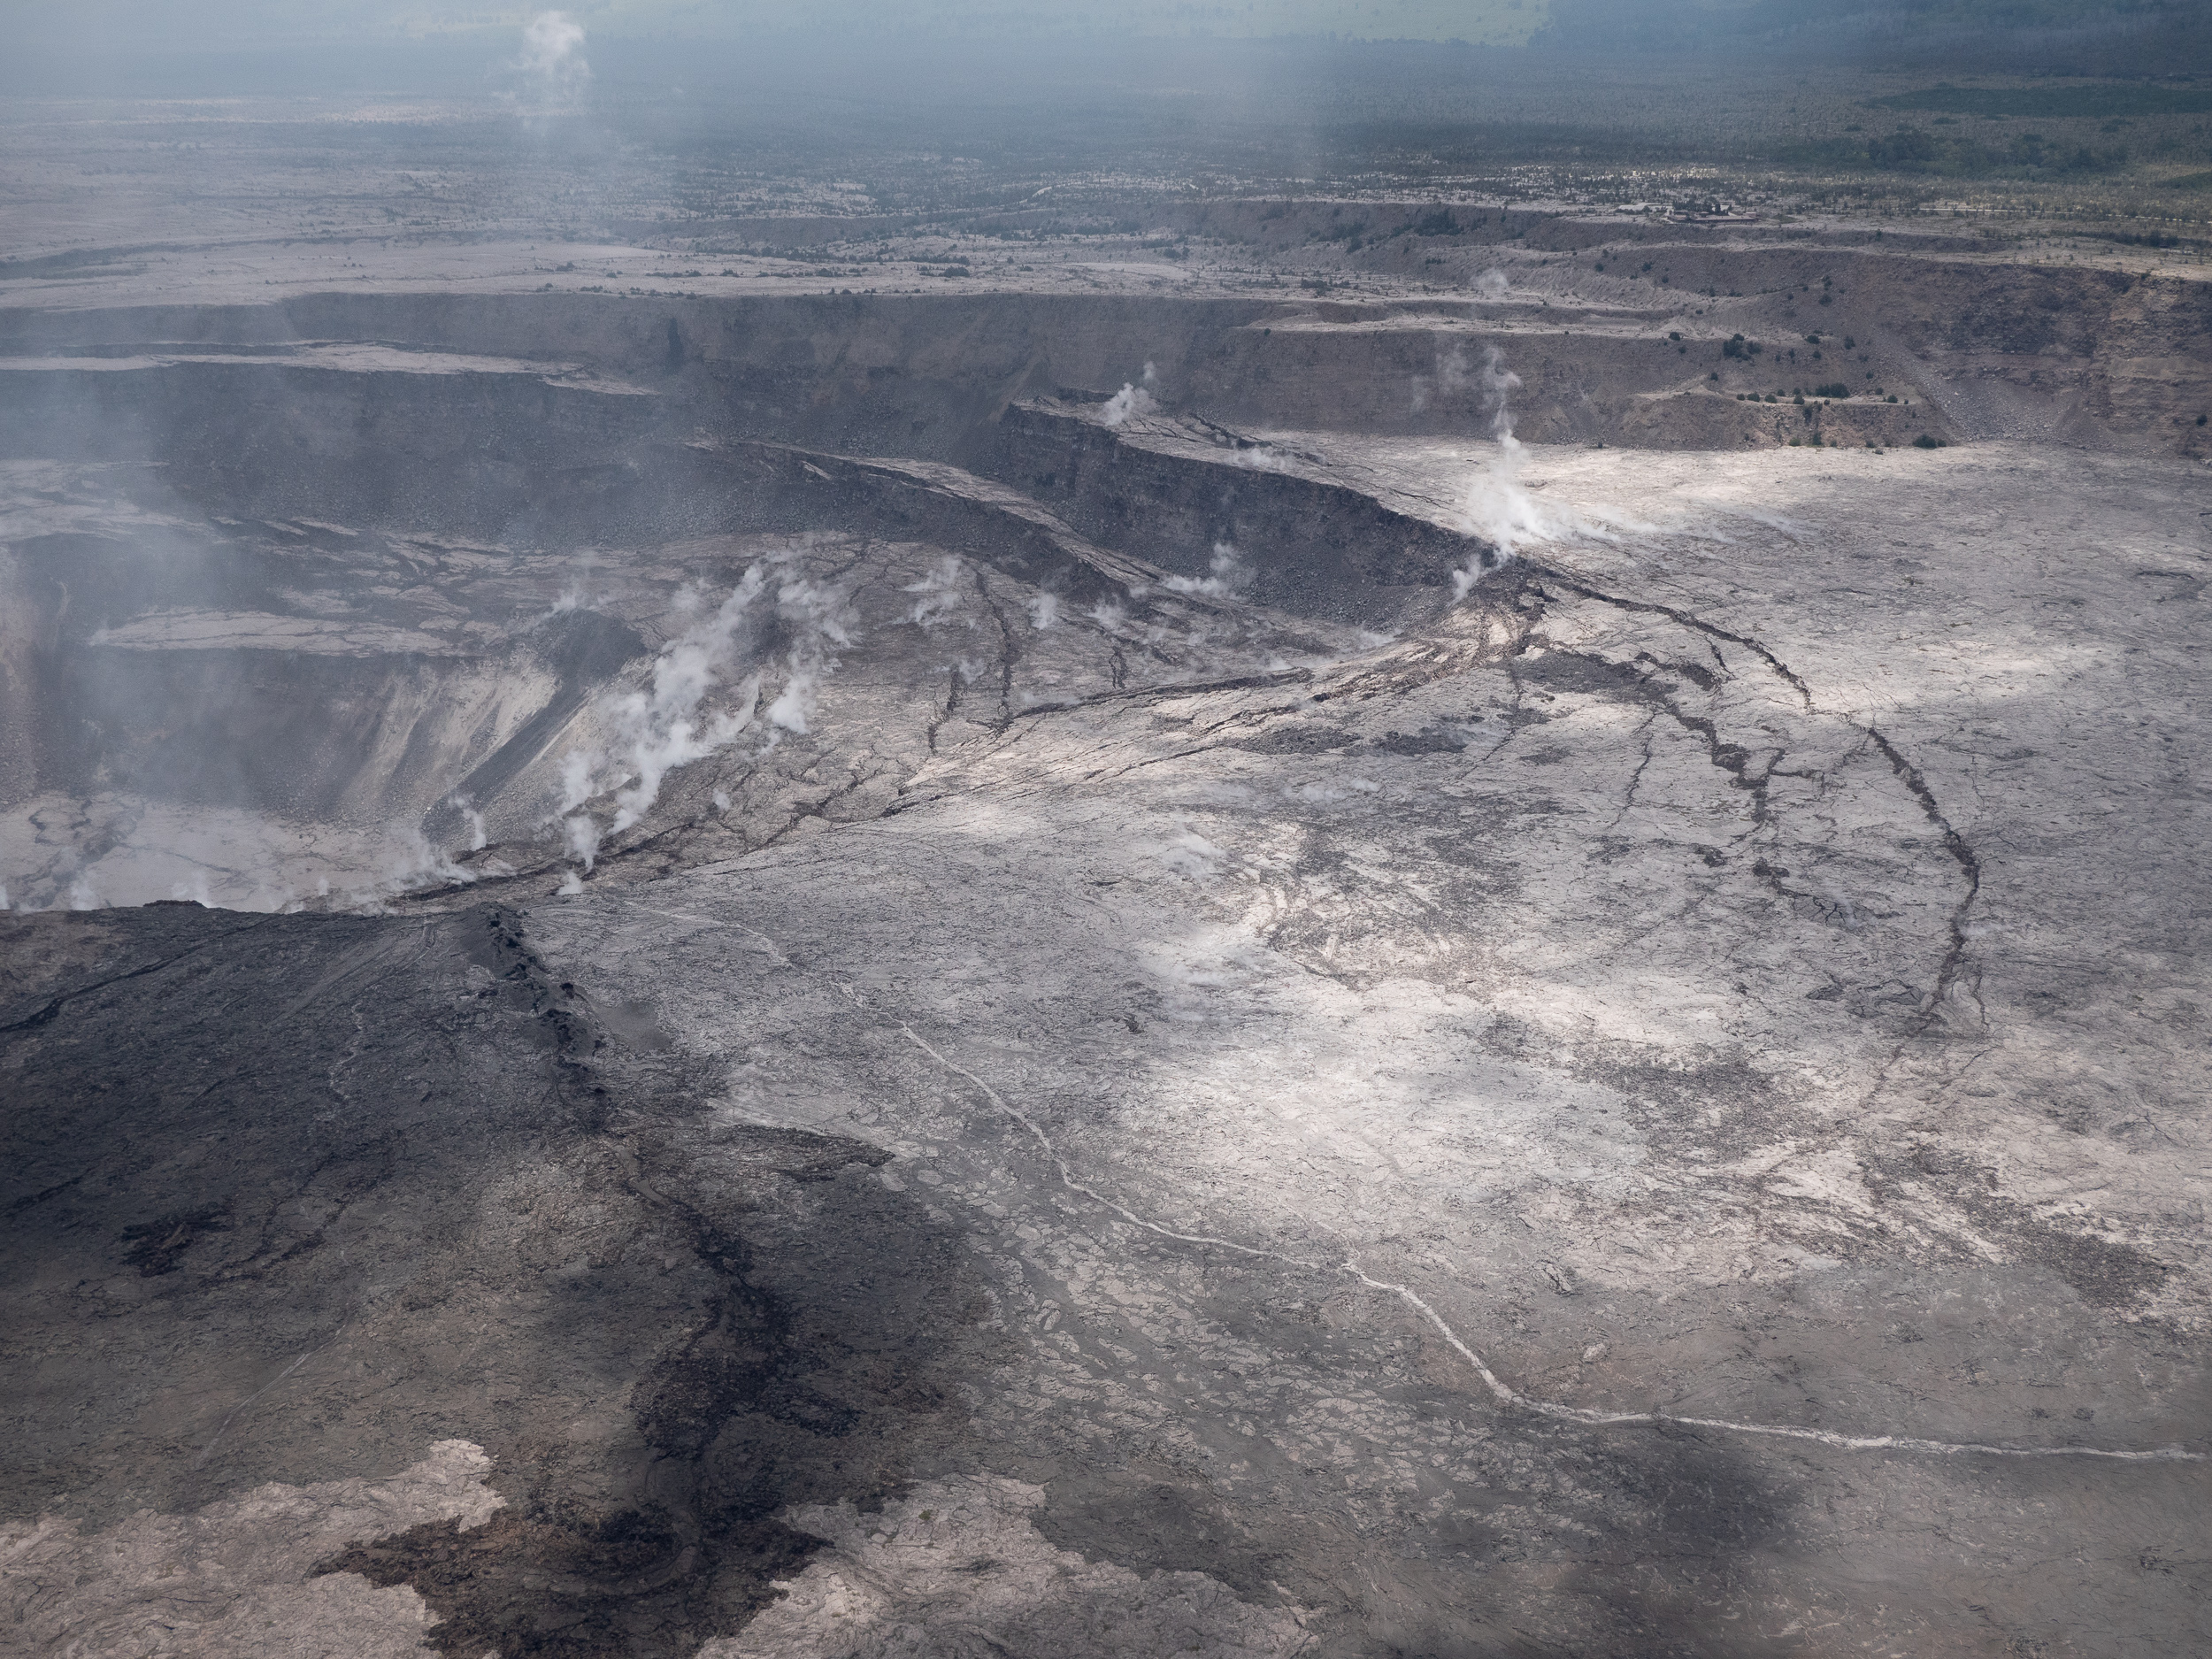
This is another image looking pretty much directly into the new crater. Someone asked me about how much volume has been— new volume has been created at a result of the collapse of Halema’uma’u. As the lava— as the magma has drained away from the shallow reservoir. And that’s on the order of 260 million cubic meters. So almost double what’s been erupted down here just in terms of space. And it seems to be continuing to subside, make more volume, on the order of 14 or so million cubic meters a day.
So it is quite dramatic. We’re all astounded by the changes when we go up there to remove more and more items from the observatory. We’re pretty much evacuating the observatory and finding new places to reside and work in Hilo.
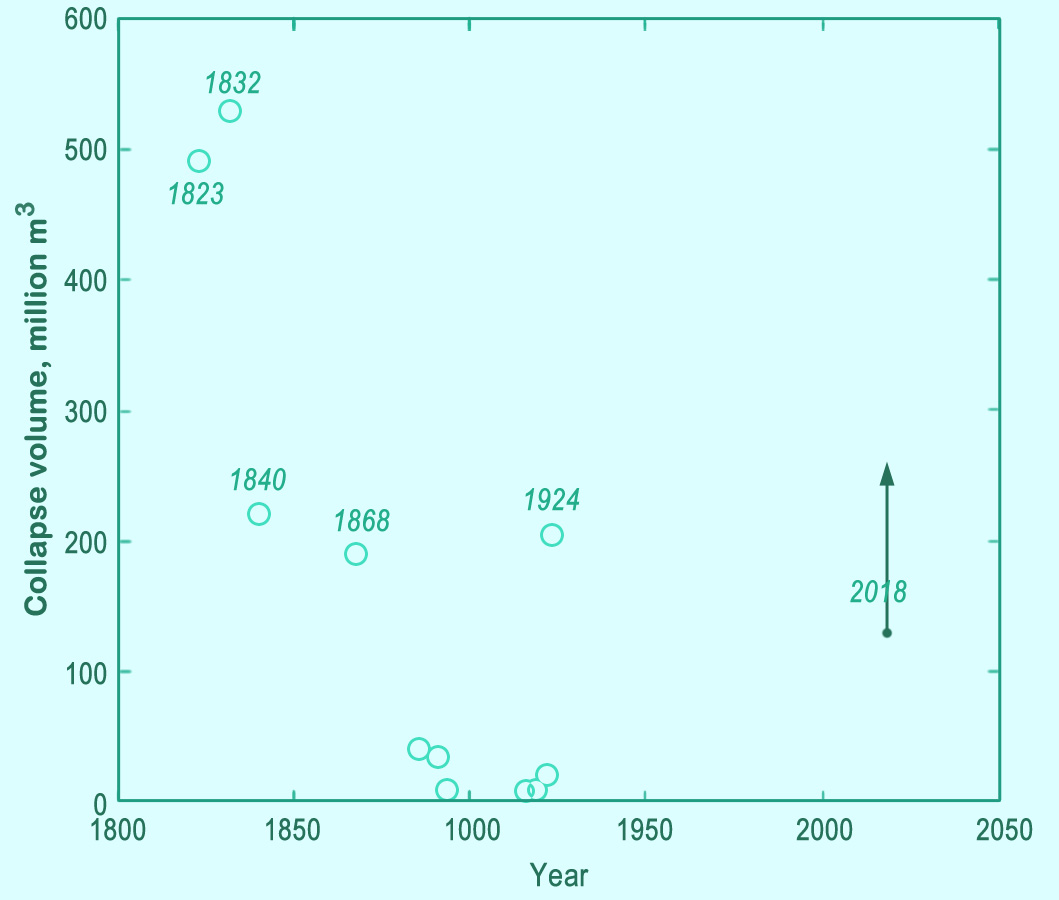
I showed you this slide last week, as a way to try to suggest that the current collapse of Halema’uma’u is not the only time that has happened in the past couple of hundred years. This is the amount of collapse in million cubic meters.[Y axis.] Again, the numbers aren’t that important; it’s just sort of the relative scale. And time [X axis].
So last week, the estimate was here [point at bottom of black arrow on right.] Now we’re up to about here [arrowhead], and it’s increasing every day about 14 million cubic meters. So you can see that it’s exceeded the similar collapses that occured in 1840, 1868, 1924. So some of the larger collapses you see here [1823, 1832] are about double. And we’ll just have to see how long this continues. For right now, there doesn’t seem to be any slowing in the rate of subsidence.
We’ve installed some additional GPS receivers at the summit to try to track the activity more closely. And we’ll just have to see how things progress through time. So thank you very much.