Fissure 8’s eight-mile lava river and the summit’s daily explosion have followed their usual pattern of the past two weeks. However, volcanic gas emissions at the Lower East Rift Zone doubled on Saturday compared to the past week, while SO2 emissions from Halema’uma’u are about half what they were before this current eruption started.
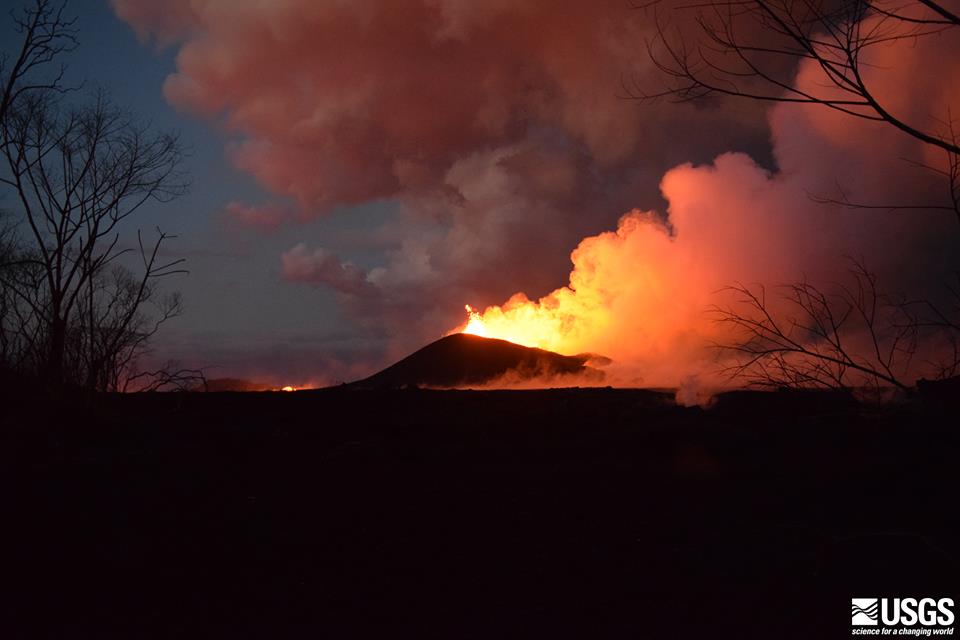
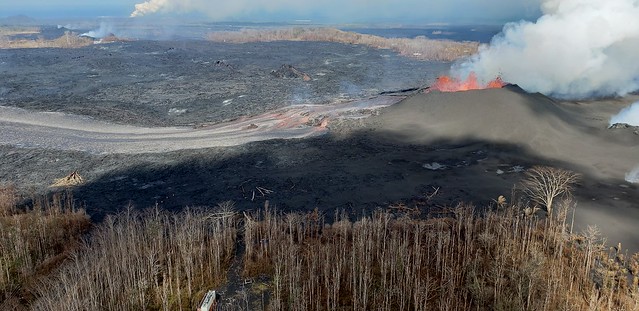
USGS: “The fissure 8 cone and lava fountaining viewed at 8PM HST on June 9 from a location on Kupono Street. The incandescence to the left is lava in the active channel.” BELOW: June 10 Hawaii Fire Department Overflight, ocean entry plume in far distance.
Are those two facts linked? I dunno. I’ll be interested to hear if/when lava samples collected from the Fissure 8 flow start to show signs they came down from the summit instead of Pu’u O’o.
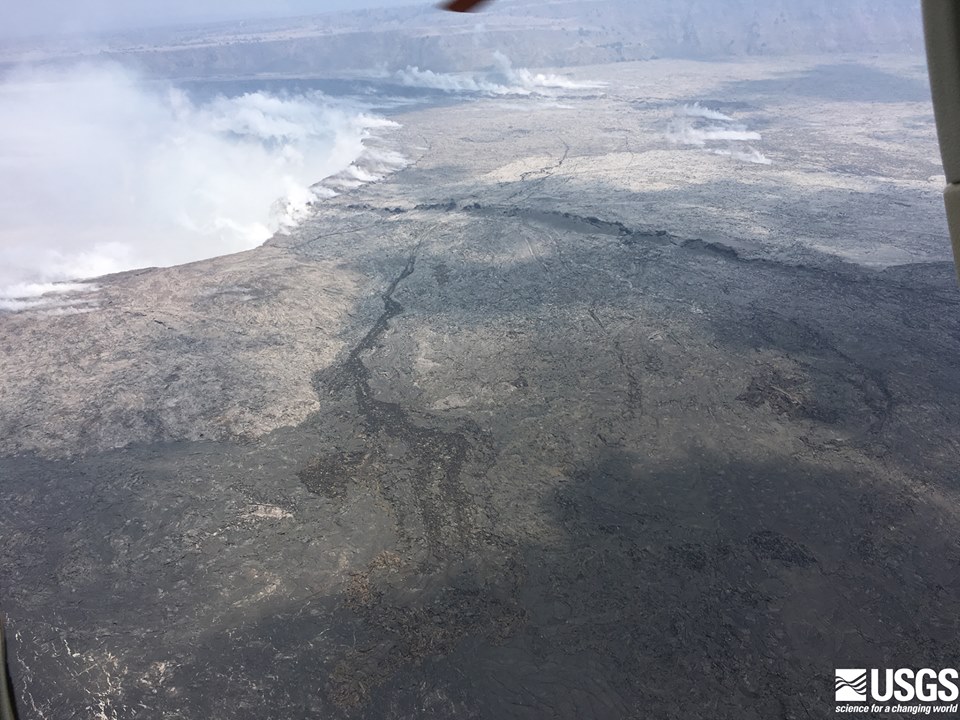
USGS: “The northern rim of Halema’uma’u Crater at Kilauea’s summit on June 9, from the noon helicopter overflight. The floor of the Kilauea Caldera is showing prominent cracking from the ongoing subsidence, and the steaming cracks in the background have been observed for several days now.”
Before-and-After Halema’uma’u 2017 vs 2018
I found a July 2017 screencap from HVO’s panorama webcam, so here’s an animation fading from it to today’s view. Check out the full-sized animation; you can really see how much Halema’uma’u has enlarged.
Be warned, there’s some sad news, especially in the social media section at the end. This is a natural disaster, and it’s hard, even if it provides some amazing visuals and fascinating science as compensation. But they can’t make up for what’s lost.
I came across this interesting paper on the last lava flow to threaten Lower Puna, just 3-4 years ago. It brings home just how remarkable the current eruption is.
Poland’s paper says that the Pu’u O’o lava flow (Episode 61e) that started June 27, 2014 was the longest at Kilauea in the past 500 years.* It eventually reached a length of ~20 km (12.43 miles), butit took until March 2015 to get there. Its average rate of speed was 0-500 meters a day.
By contrast, Fissure 8’s current flow started on May 26, 2018, and covered 13 km (8 miles) to the ocean by the evening of June 3 (eight days). At times it exceeded 500 meters per hour.
This explains a lot.
I wondered why some residents of the Kapoho area said their evacuation orders came with “no warning,” or they didn’t bother to evacuate their belongings, or they didn’t think the lava would reach their house, even though the eruption had started a month before, and lava had been moving their way for a week.
But they’re used to the Pu’u O’o eruption of the past 35 years, which took years and years to reach and cover the community of Kalapana. The current eruption is covering as much ground in a week as Pu’u O’o took months to cover. And Pu’u O’o was traveling farther than any eruption in 500 years.
No wonder people were caught flat-footed!
Below: I created an animation of 3 HVO/USGS maps to show Pu’u O’o vs current Lower East Rift Zone lava flows.
Maps used to create this animation:
USGS April 30 map of Pu’u O’o active lava flow (pink, Episode 61g, May 24, 2016-Apr 30, 2018) and older Pu’u O’o flows (gray, Jan 3, 1983-Apr 30, 2018)
USGS May 2 map showing magma was moving into Lower East Rift Zone (inferred by earthquakes); Pu’u O’o lava flows of past 35 years shown in pale pink, episode 61g in dark pink. The 2014-2015 (episode 61e) flow is the light Y-shaped area extending to the northeast. (Sorry, I don’t have acreage numbers for episode 61g, or for that matter final totals for the Pu’u O’o lava flows.)
USGS June 10 map of active lava flows in Puna (Lower East Rift Zone) since May 3, 2018, with current flows in pink and historical flows (including the 2014 Pu’u O’o mentioned in that paper) in purple.
In short, the current 2018 eruption is hotter, faster, and covering so much ground that it’s surprising even to geologists, let alone residents. This is not the kind of volcanic eruption they’re used to.
*(Pu’u O’o’s 35-year eruption was exceeded by the 60-year Ailā‘au eruption that created the Thurston Lava Tube in the 1400s. After which, Kilauea caldera collapsed, and there were 300 years of explosive eruptions before Kilauea reverted to effusive (lava) eruptions. But don’t panic: we’re nowhere near 60 years of continuous lava flows even now. Also, two weeks ago the USGS said that only about 2% of the volume of magma in Kilauea’s magma chamber has erupted since May 3, and it’s still being resupplied from below.)