Today’s Eruption Summary
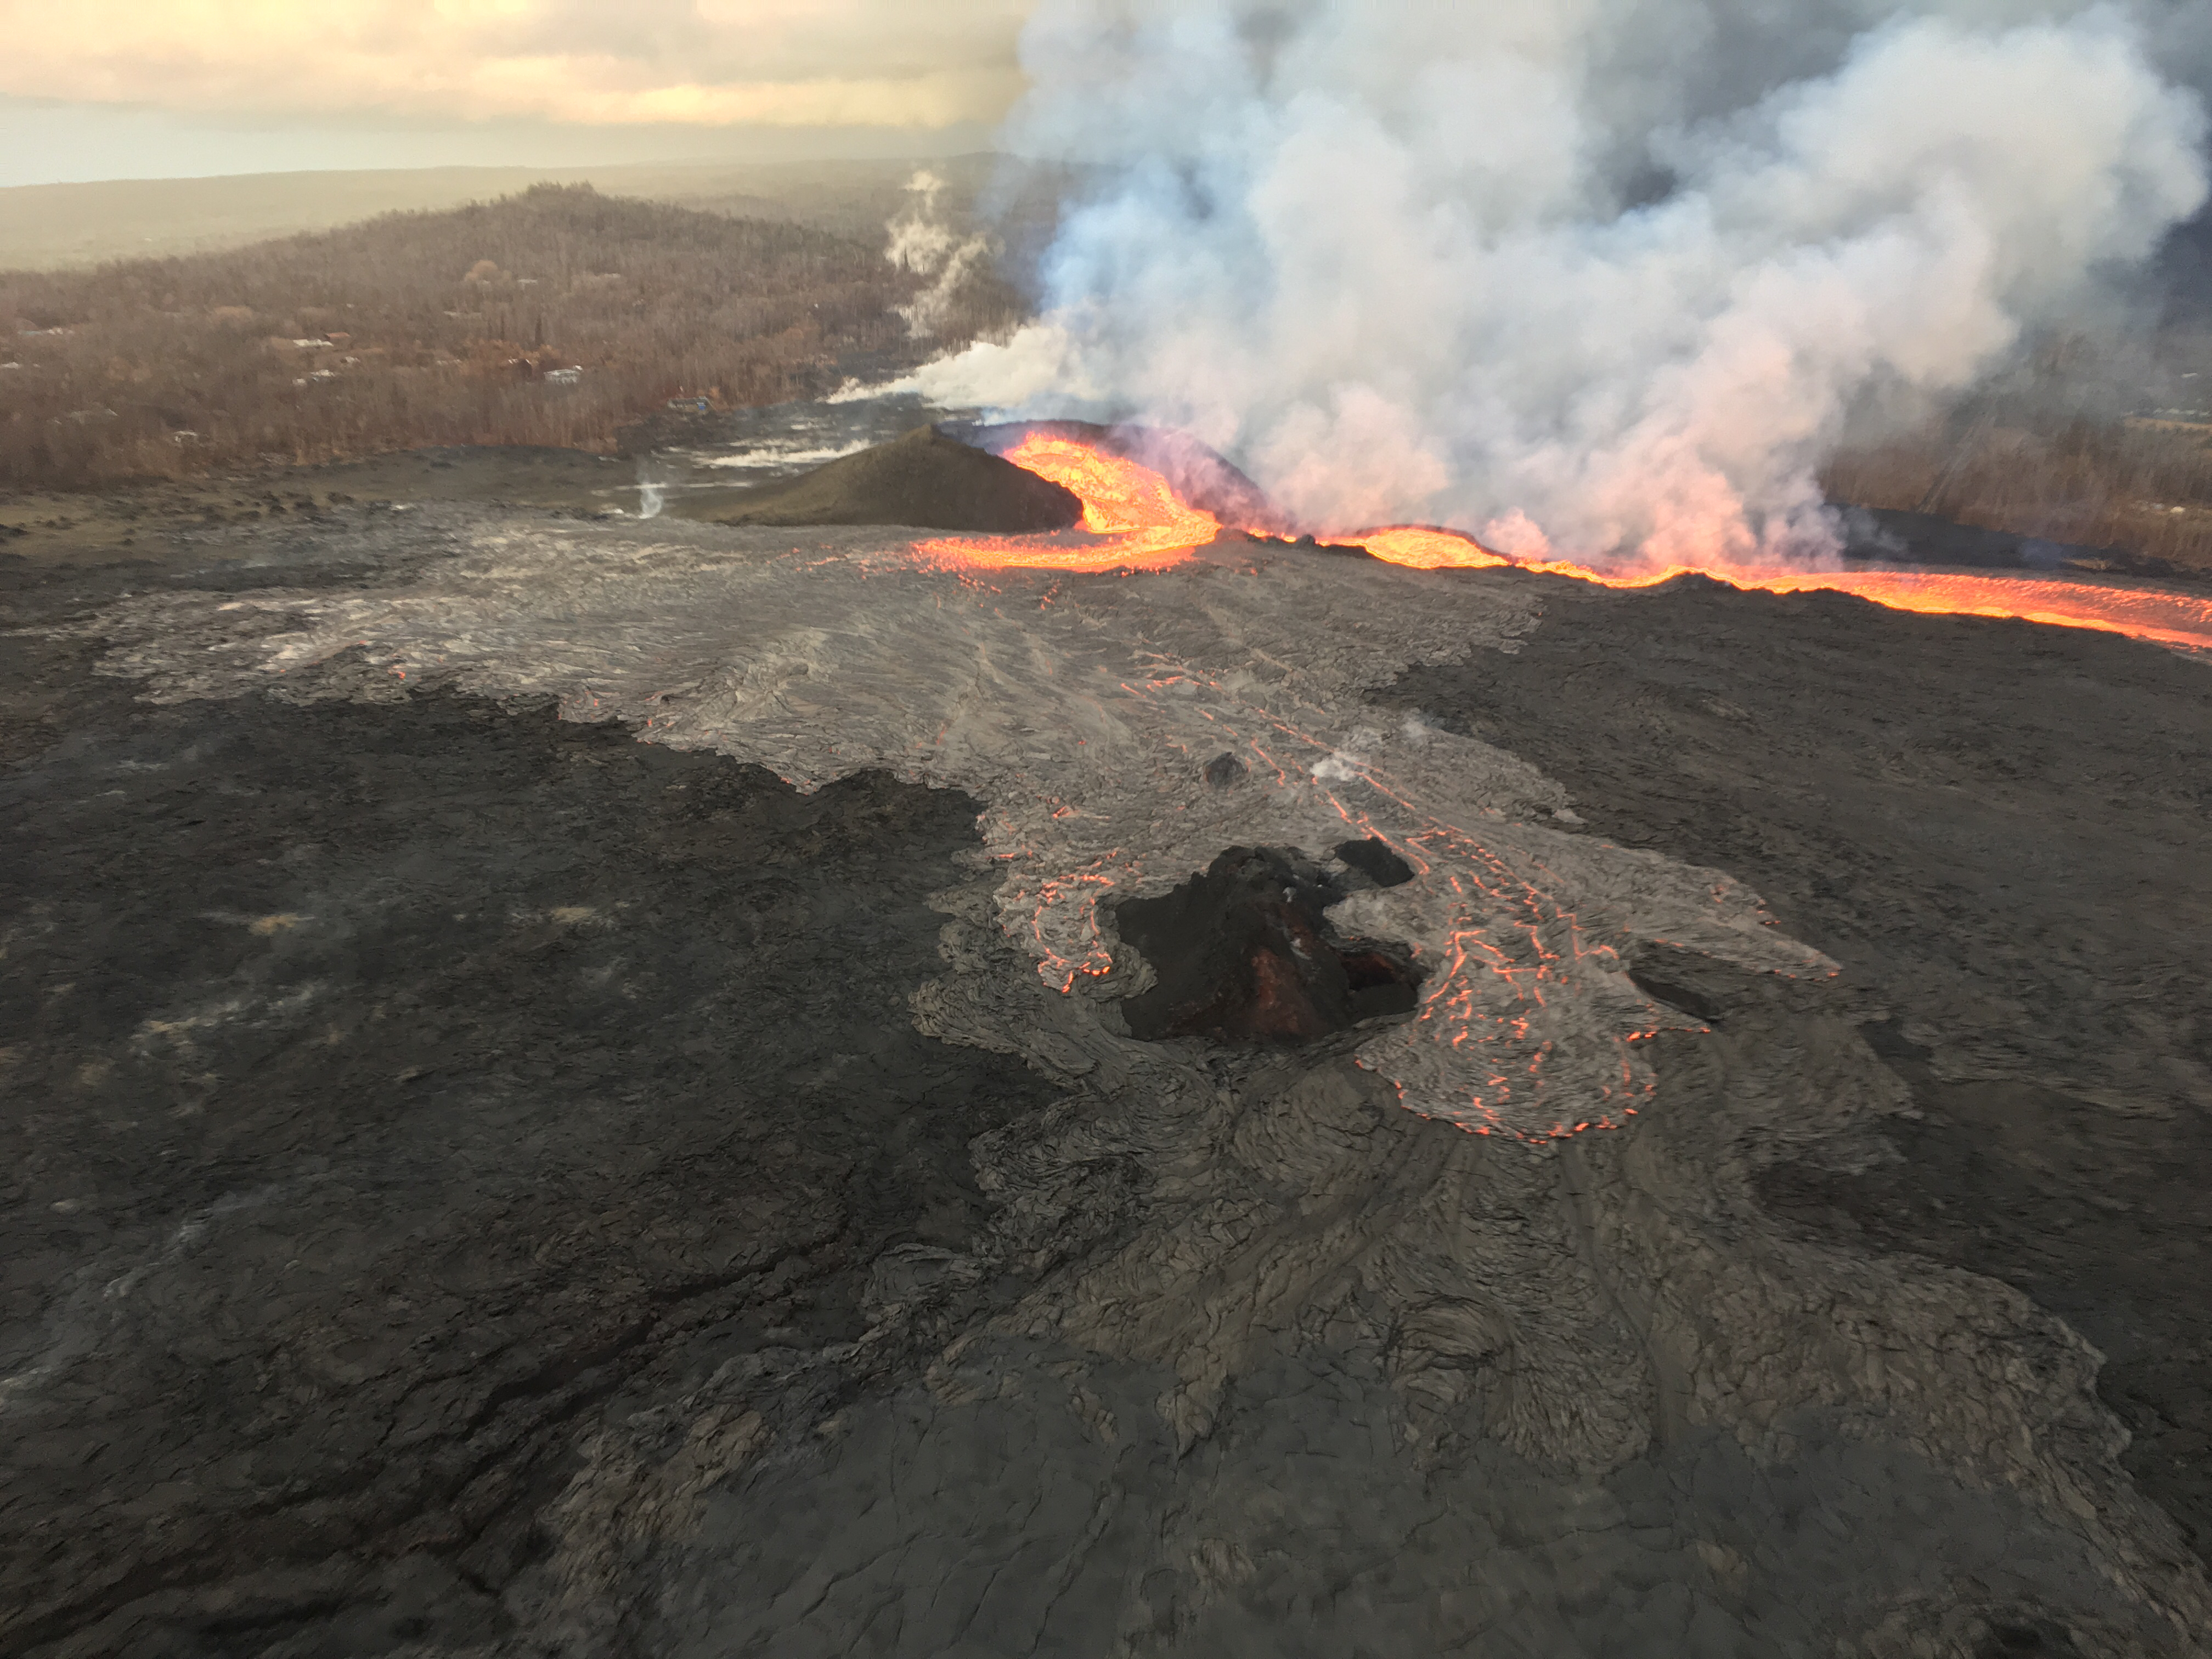
Kilauea’s double eruption continues as usual. Fissure 8’s lava river is still sending lava mostly to the southern ocean entry near Ahalanui, following the diverted channel on the west side of Kapoho Crater. The southern margin of the lava flow along the coast has slowed its southward advance, possibly giving Pohoiki/Isaac Hale Park a respite. At 7pm HST, HVO said it was “around half a mile away.”
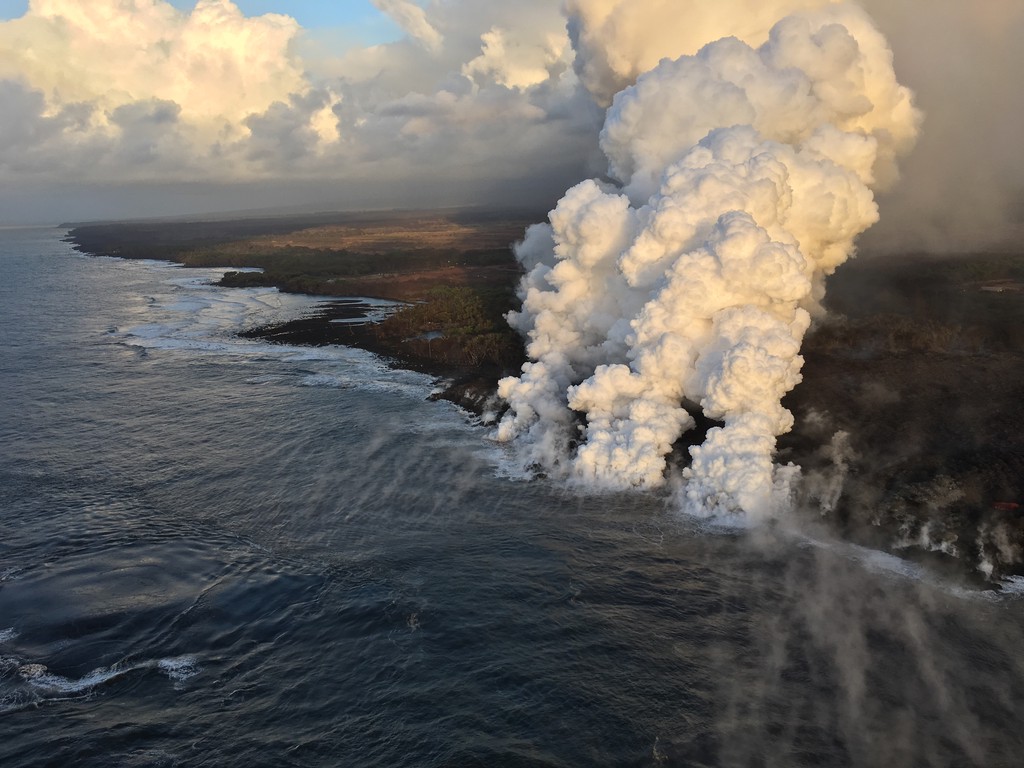
The tiny island that formed Friday is now a tiny peninsula, joined to shore by a neck of lava or possibly just black sand. Lava continues to ooze into the ocean here and there along the broad front of 6 km (3.7mi) lava delta. Recent HVO Kilauea status alerts have warned that this delta has built out 0.5 miles from the former coastline, and is resting on “unconsolidated lava fragments and sand,” which can give way.
Following this morning’s 3:26 am collapse event (M5.2) at Kilauea’s summit, a pulse of lava came down the rift zone to Fissure 8. This caused an early-morning, temporary overflow to the ESE which did not extend beyond the boundaries of earlier flows. (This spillover was very visible during a 6:30am @hotseathawaii livestream overflight). No other vents show any activity.
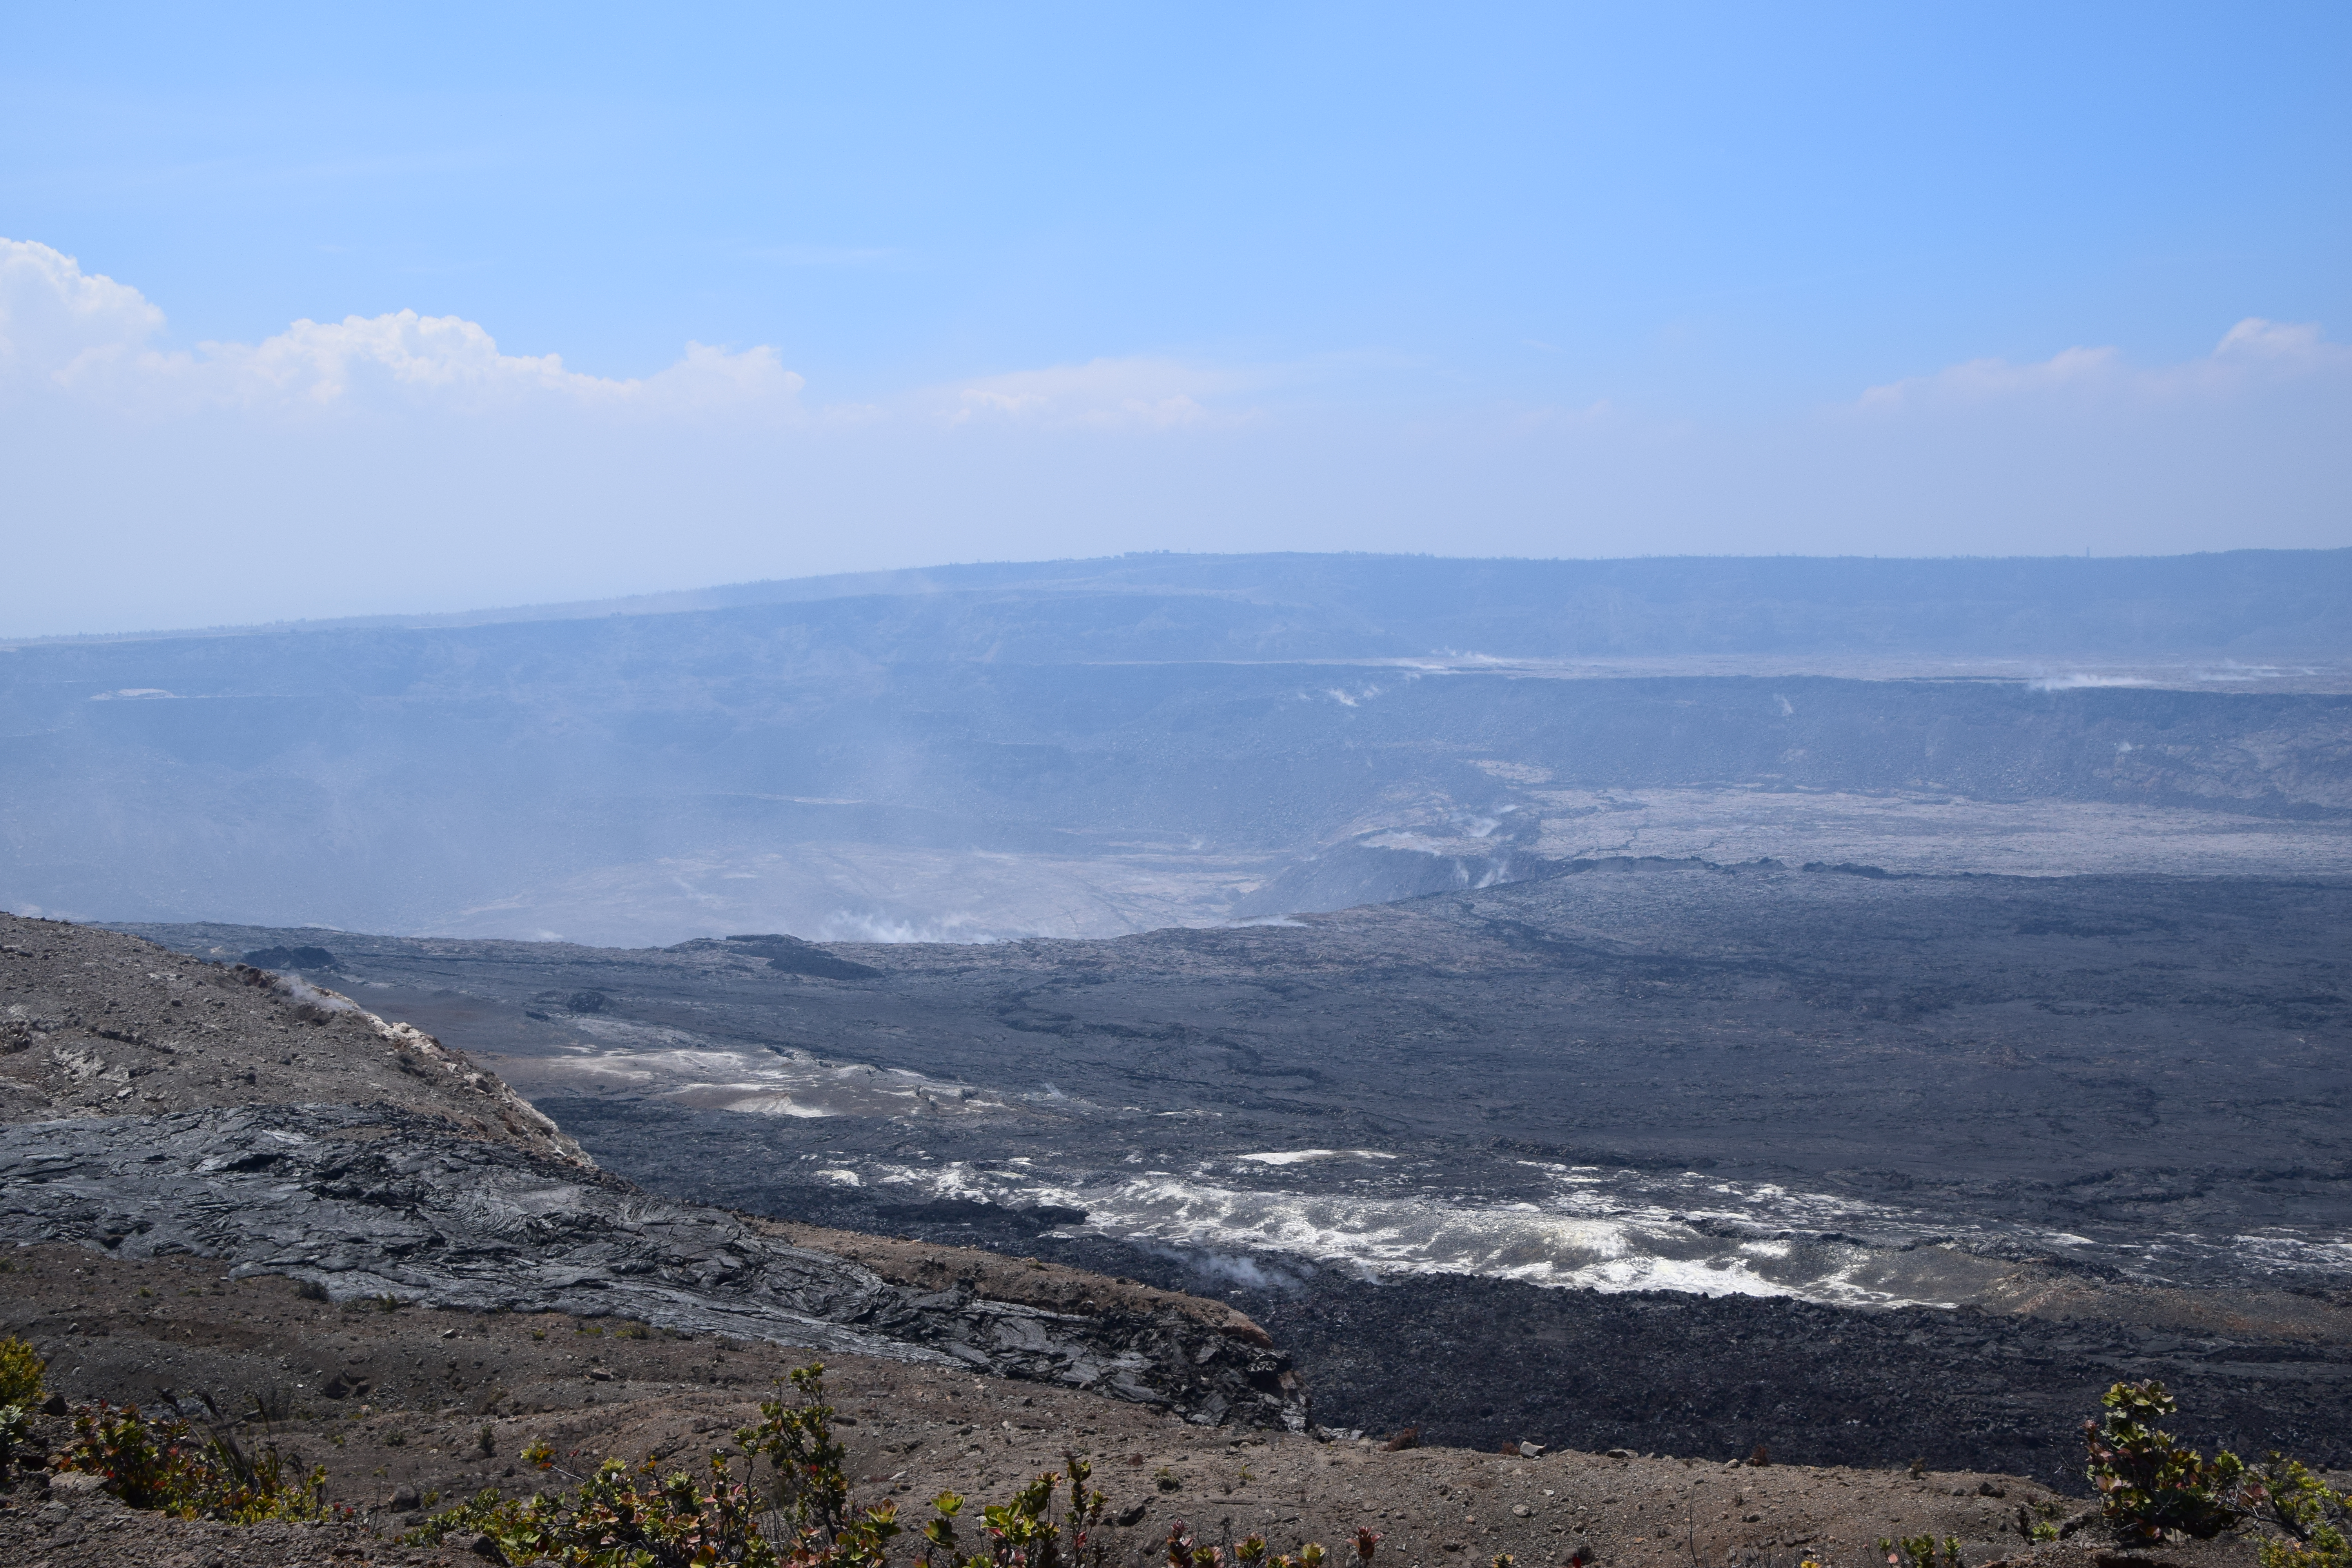
And a reminder of what it used to be like…
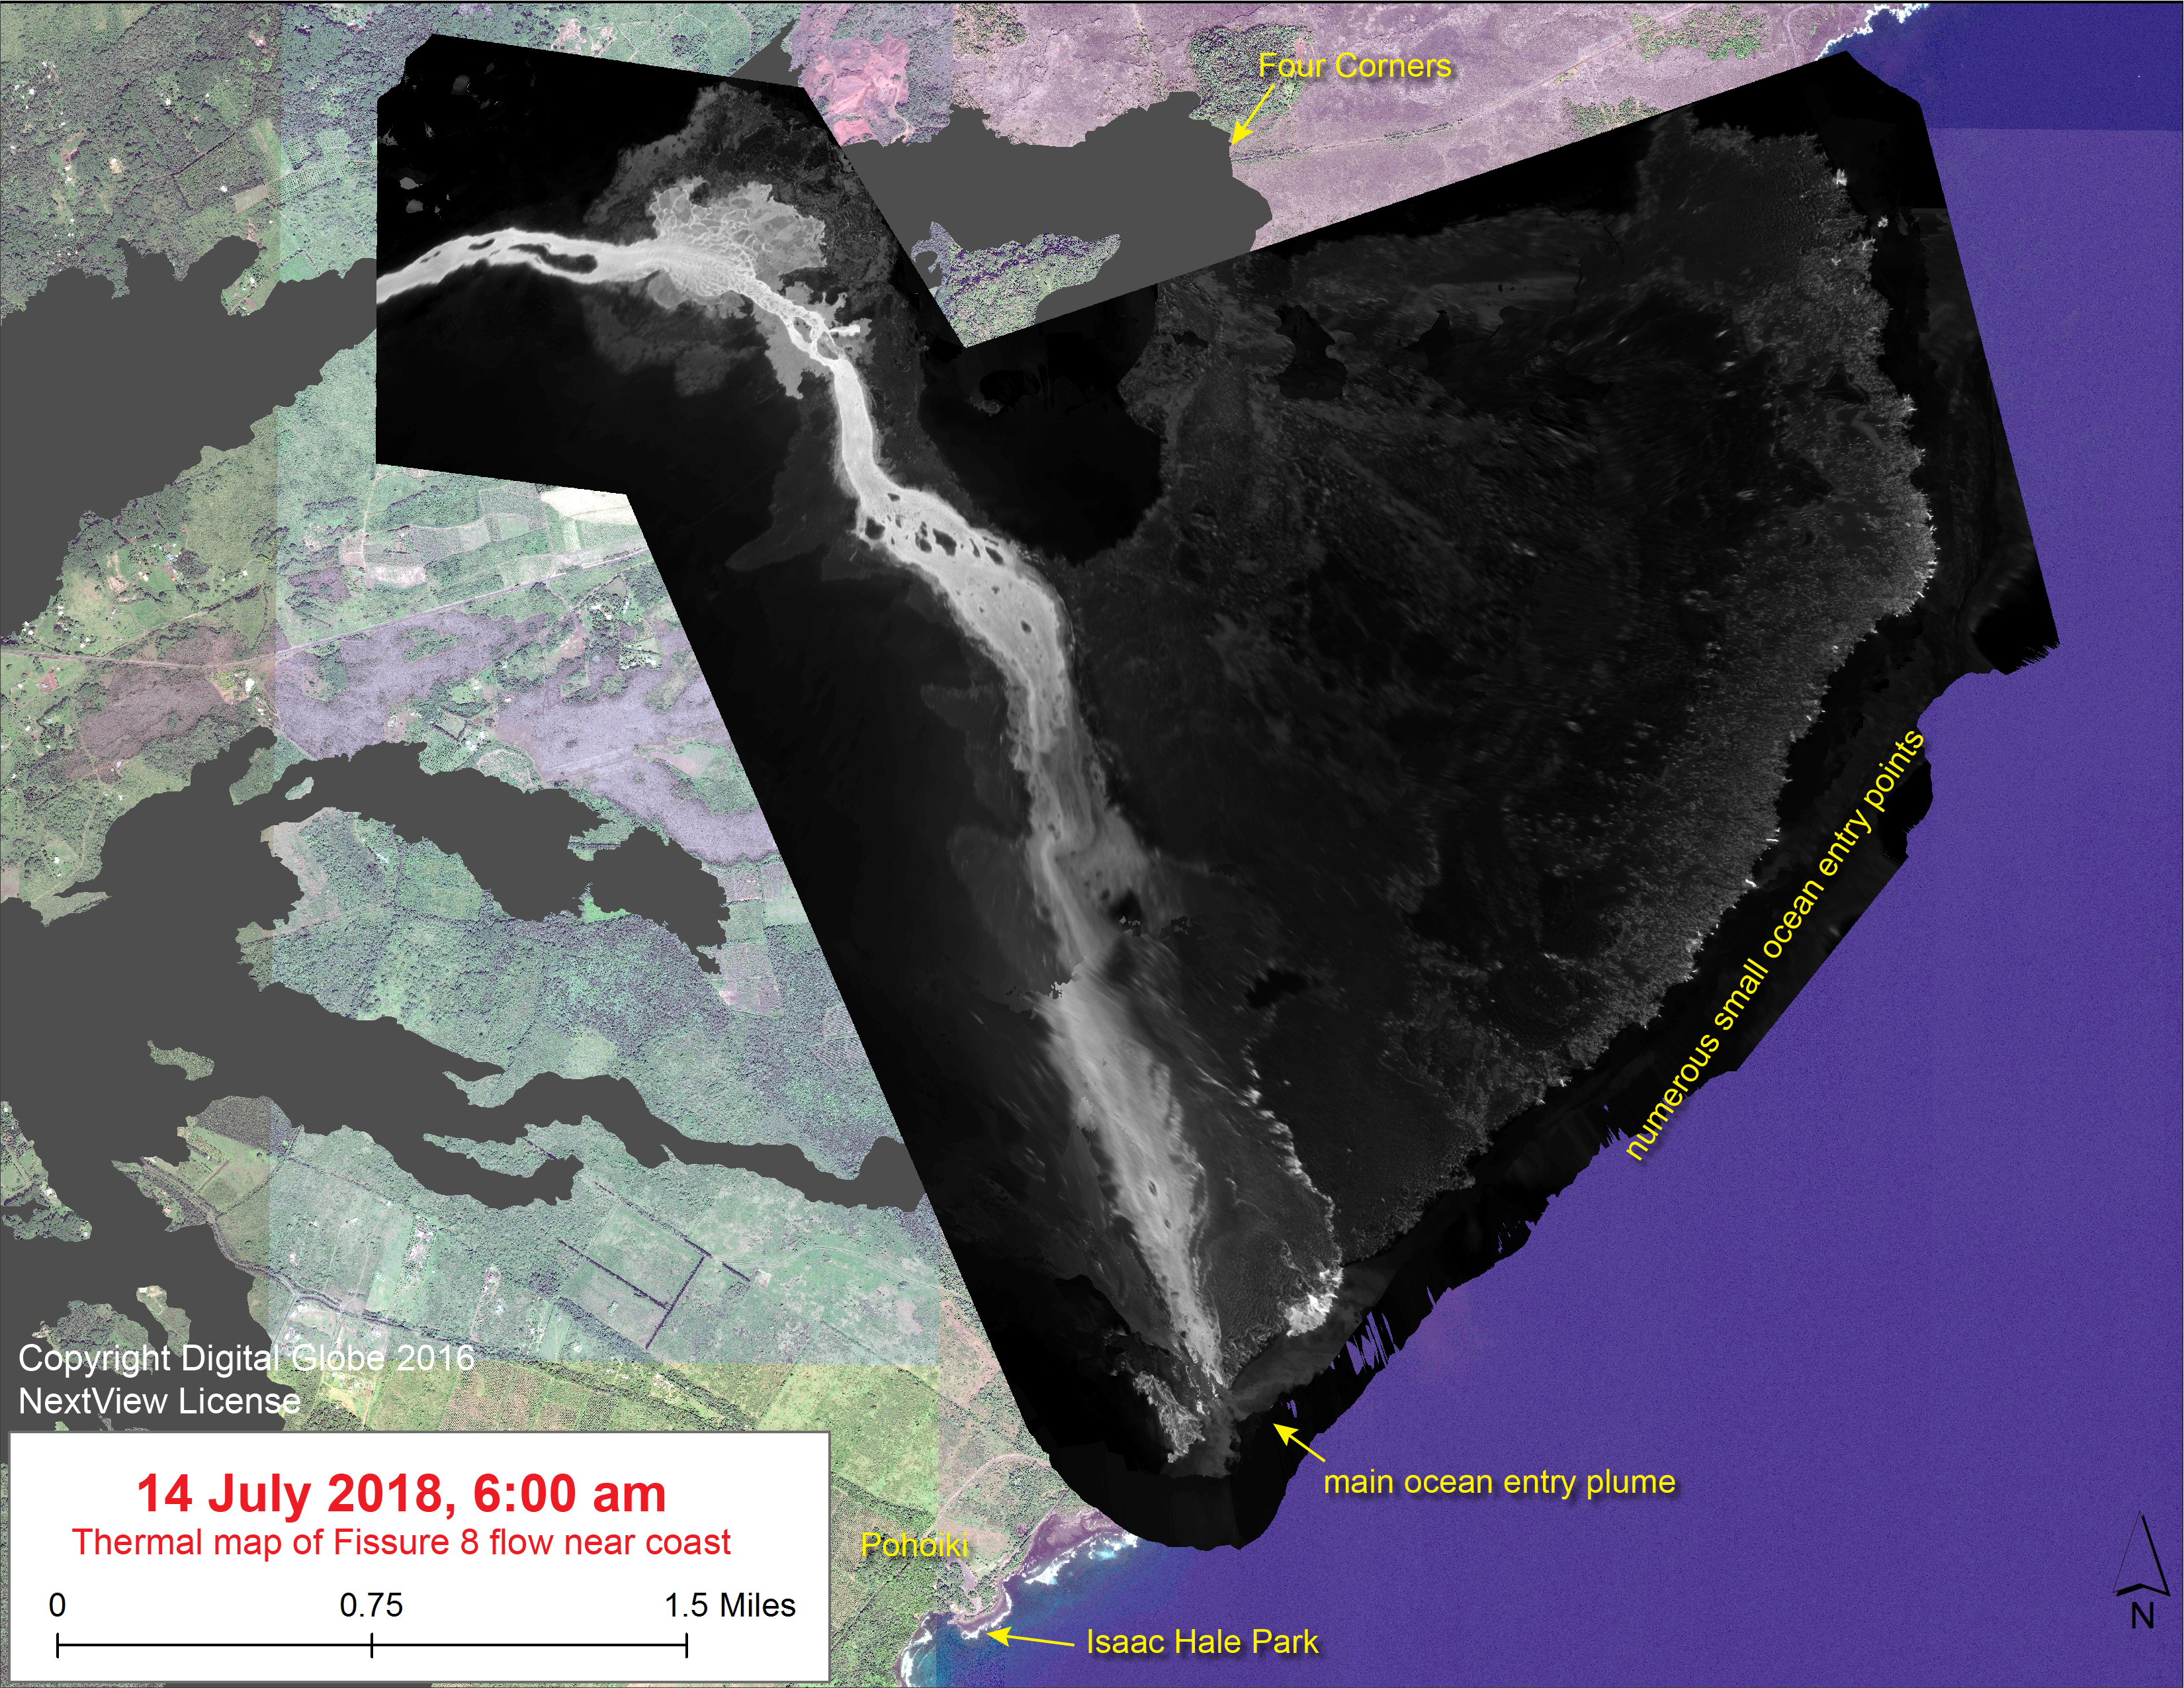
Most Recent thermal Map
It sounds like the flow field hasn’t changed all that much in the past 24 hours, apart from that temporary spillover near the vent. Yesterday’s thermal map was posted this morning. Stormy weather prevented them from imaging the area close to Fissure yesterday:
From Local News MediA
(What little there was today mostly recapped HVO morning report, which I’ve already covered.)
- HSA: “New rules apply to new lava-scape“
- KITV: “Kua O Ka La Charter School plans for new school year”
- HSA: “Big Isle mayor wants to kill land purchase“
- HTH: “Field trip raises spirits of summer group from Pahoa affected by lava“
- And “Dispatches from Volcano” comments on F8 beginning to fluctuate and digs up now-completely-outdated 2003 geological maps of the summit (by Tina Neal and Jack Lockwood). Be sure to scroll down below the map in the second link— there’s photos I’ve never seen before of 1967, 1971 and 1974 eruptions at Kilauea’s summit.
That was pretty meager. I watched @Hotseathawaii’s 6:30 overflight this morning, and it was newsworthy… come on, Mick and Bruce, don’t let me down!
…oh good, Mick posted. The surge and overflow look even more alarming with his HD camera, and there’s good glimpses of No-Longer-An-Island as well as Pohoiki/Isaac Hale Beach.
Mick Kalber Early Morning Overflight
USGS Q&A on social media
[Comments on thermal map]
Q (me): When the weather allows for a complete survey of the flow field, about how many photos do you have to collect in order to have enough data for the thermal map? Hundreds? Thousands? And about how long does it take for software to piece them together into a single image?
USGS: It takes anywhere from 300-600 photos, depending on altitude, and takes about 3 hours to stitch together into a map.
Q (Audra E Gray): I notice that there isn’t much heat in the old part of the flow (such as nearer Kapoho), but the very edges of some of that shoreline is bright. You also indicated in a previous post that the new little island was further up the coast away from Ahalanui. Does that mean that there are probably multiple lava channels reaching out in those directions (to all of the bright spots up the coast)? If so, does the fact that I don’t see white regions reaching out that way indicate that those potential channels are fairly deep below the surface of the lava in those areas? How deep can your cameras detect heat?
USGS: The little bright spots are probably small seeps. And the level of the gray scales with temperature in an extreme way, so the gray areas are still pretty warm. There are almost certainly many pockets of liquid lava under a hardened crust, and these seep out from time to time. So yes, there are probably multiple channels here and there. Sometimes these sorts of channels can remain active even after the flow is cut off. For example, during the Pu`u `O`o phase of the eruption, we would see lava draining out of the tube at the ocean entry for up to a couple of days after eruptive activity at the cone paused. As for how “deep” the cameras can see, it depends very much on the volume of subsurface lava. During Pu`u `O`o days, we could often “see” the tube, even though it did not break the surface between Pu`u `O`o and the coast. That tube might have been a few meters deep, but was always full of lava. So it very much depends on a variety of conditions.
Comment: I call dibs on the island!
USGS: No dibs! All new land formed in eruptions on the Big Island belongs to the state. And the ‘island’ isn’t an island anymore – it has been connected to the main flow by a strip of lava.
Comment: If you have a naming contest please exclude “Lava McLavaface” from the possibilities.
USGS: We’re not in charge of naming anything, so fortunately we won’t have to worry about that. Also, it’s been connected to the flow by a small isthmus, so it’s not an island anymore!
@USGSVolcanoes Aloha ~ Can someone explain the below photo USGS posted today. I'm not seeing a plume rising from the fissure itself, as usual, but a lot of smoke around the fissure… to the right in the photo. Mahalo. pic.twitter.com/QHSddhWPFz
— John Calvert (@JCalvert808) July 16, 2018
USGS: The plume is rising from the lava in the fissure and the lava channel immediately nearby. That area is very active and churning, which may help facilitate gas release. (Also, no smoke here – it only forms when something is combusting. All of this is water vapor & other gases.)
Followup: OK, still confusing to me, because I think of “plume” as something rising from the fissure, and it often does look like that, but you are saying it’s rising from the lava? Why not then rising from lava farther down the flow? Does this stuff have a technical name? Mahalo.
USGS: Yes, it is a gas plume rising from the lava. It likely is rising from the lava farther down the flow, but the farther it travels, the more gas it loses.
Followup: Are you seeing variation in this gas plume correlating to the pulses caused by Halemaʻumaʻu collapses? If so, are the variations becoming more pronounced over time?
USGS: There seem to be several cycles of increased activity happening: surges following summit collapse events, and shorter-timescale (minutes-long) increases and decreases in flow at the vent. Gas output at the vent varies on the shorter timescale, but not sure about the longer one.
Q: [Has the cone shrunk or partly collapsed? It looks smaller in recent overflights.]
USGS: Not that we’ve observed. The cone has expanded laterally over the past few weeks, and it’s not really fountaining anymore. These may be combining to give the impression that the cone has shrunk (especially if there are no objects for scale in the camera view).
Q: [The F8 plume looks smaller. (shows current screencap from PGCam)]
USGS: It may be because of yesterday’s weather – winds were very gusty near Fissure 8, and there were lots of low rainclouds that may have obscured it. Our field crews can assure you that it was still pretty robust.
[Similar questions on Facebook.]
Q: Why is the F8 plume thinning, even vanishing at times? I live at the top of Leilani Estates; thinning started yesterday.
USGS: Fissure 8 has begun experiencing alternating surges and lulls in effusion rate. There is more gas being released during the surges and less during the lulls, which might explain what you are observing.
Q [Again, FB]: [Has F8’s flow rate dropped off in the past few days?]
USGS: It seems to be waning yes, although there is quite a bit of variability in the output (surges and lulls). It’s unclear if this is part of an overall waning trend, or more of a subtle lull after which we could see an increase again.
Q: [What’s with the overflows?]
USGS: The overflows are a result of the surging behavior of the fissure — the lava jumped its banks and is feeding an overflow on the east-southeast side of the cone. It’s not yet traveled very far, and will probably be cut off after the surge passes (that might already have happened — UAS crews are on site examining the area now).
[Oh look! Janice Wei — HVNP photographer, so presumably she’s allowed to be here— filmed the UAS crew in action!]
Q: Is this the largest volcanic event in recent recorded history of this area?
USGS: It is the largest since 1840, in terms of area and volume of lava. Whether it rates on the VEI scale, which involves energy expended and explosivity of the summit eruptions, that remains to be seen – it can’t be calculated until the eruption is over. https://volcano.si.edu/volcano.cfm?vn=332010&vtab=Eruptions …
[And now for the nerdy FB question of the day]
Q (Jennifer Geraghty): A couple days ago, someone showed me this website that shows the data from many of your seismic monitors. I noticed the other day that the “ERZ 4” monitor had a faint line of yellow at the very bottom, that was continuous across the graph. None of the other monitors had that – they showed increases during a quake, but nothing continuous. Now, today, the “ERZ 4” monitor has a LOT of continuous “noise” – not only the yellow band at the bottom (which is a lot wider than before), but a LOT of wavy “noise” that doesn’t seem to be corresponding to the quakes. I guessed that this monitor was near the lava channel, and the noise was from the constant ground vibration of the moving lava. Could you please tell us where this monitor is, and what this sudden change is indicating? https://minetick.de/seismo.php
(Another member says it’s near the big cinder pit.)
USGS: Just finished talking with a group of seismologists (they were in the field today). They indicated that the yellow line at the bottom is just noise, which appears to varying degrees on all stations and can rise or fall depending on weather, ocean entry activity, lava flow activity, etc. The wavy lines are helicopters. Hope this helps!
Q: [Maybe Kilauea is now dead, and Fissure 8 is the new primary vent for the hotspot?]
USGS: If that were true, we wouldn’t see any involvement of the summit in the present eruption. But clearly the summit is involved, since it is subsiding as the lower East Rift Zone eruption. The magma chambers there are draining to feed the eruption. Although this eruption is remarkable for our times, it is really just another example of what Kilauea does, and there are many cones along both the East and Southwest rift zones that show that similar activity has taken place in the last few thousand years. There is a well-oiled pathway from the hotspot to the summit, so there’s no reason to think that would be abandoned in favor of some new pathway. If for some reason there was a new pathway forming, we should see all kinds of strange seismicity ten kilometers (or more) beneath Fissure 8.
Q: [What will this eruption do to world sea level?]
USGS: Well, pretty much nothing. The volume going into the ocean is not sufficient to have an impact on sea level, and the climate impacts outside of the area of the eruption and some other parts of the Pacific will be negligible.
[Replying to USGS’ tweet saying seismicity is increasing again following a few hours of relative quiet after most recent collapse.]
Q: Seismic activity a reaction to the collapse? Is there a possibility of a larger explosion at the summit?
USGS: The seismic activity at the summit is a result of the ongoing collapse process. We have not seen significant explosive eruptions (with plumes) for several weeks, but that does not eliminate the chance that they could resume at some point.
Q: If these were to resume briefly and then stop again could it theoretically cause an increase in slumping by clearing the crater floor and rockfall debris out?
USGS: Only if the explosions were strong enough to blow the debris completely out of the crater. Otherwise, they’d fall right back down into the vent.
Rumor Whack-a-Mole
Q: Would these puffs that are occurring every min or so from Kilauea indicate the main cauldera is beginning to fill with lava again? Would there be an eruption of all the material that has caved in?
USGS: Those puffs are pretty normal. The summit is definitely not filling with lava again (yet) because it is still deflating and subsiding (indicating depressurization). You can follow this deformation athttps://volcanoes.usgs.gov/…/monitoring_deformation.html (scroll down to “Real-time Global Positioning System at Kīlauea’s summit, past week”)
[Another commenter said “Dutchsinse debunked again!” Apparently this is the topic of his latest video. He really loves to hype up nonexistent eruptions.]
Q: [Mauna Loa is having 1-2 earthquakes a day. Is this significant?]
USGS: Mauna Loa has experienced a small swarm in the last few days. A couple of earthquakes a day is not abnormal, given that it has shown inflation in the past few years and has a large magma chamber. But the recent swarm is pretty small. Attached is a plot of the numbers of earthquakes each week at Mauna Loa since 2013. You can see the recent uptick because of the recent swarm, but that’s still quite small compared to what we were seeing in 2015-2017. This serves as a good reminder, however, that Mauna Loa is an active volcano and might erupt at any time, so we have to keep a close eye on it. Vigilance is key.

Q: Do you think the plates have been affected? Hualalai, and Mauna Kea has been quaking too. Did they all tilt or shift maybe?
USGS: There isn’t any evidence that anything has changed in terms of plate motion. That doesn’t really happen on human timescales (and GPS data from other islands, and other places around the world, confirms this). As for Hualalai and Mauna Kea, those earthquakes are the sorts of random events that always take place on the Island of Hawaii — it’s one of the most seismically active places in the country! Many of the deep events are actually due to the weight of the volcanoes on the ocean floor. These can be quite large — for example, the M6.7 Kiholo Bay earthquake of 2006 was a result of the mantle cracking in response to the weight of the island!
Q: Hawaii cracked the earth?!
USGS: That’s right! Amazing, isn’t it? But these mountains are huge, and really heavy. Mauna Loa is taller than Mount Everest (it starts about 40,000′ below sea level), and has a lot more volume, and that’s just one of 5 volcanoes making up the island. It’s a local effect — we only see these styles of earthquakes beneath and surrounding the islands — it’s still pretty mind boggling.
From Other Photographers / Social Media
That island everyone was excited about is now no longer an island. Sorry. Was good while it lasted
(JK, it's just sand connecting it to land). Image credit to Philip Ong (Dr. Phil) #Kilauea #LeilaniEstatesEruption pic.twitter.com/eDOxSu8vOB
— Dane duPont (@GeoGolfHawaii) July 16, 2018
Update: Lava from #KilaueaVolcano in #Hawaii observed by the new #Sentinel2 imagery on 12 July 2018
1. See changes 5 days apart (from 7 July to 12 July 2018)
2. SWIR bands able to detect hotspots / lava flows@CopernicusEMS @CopernicusEU @USGSVolcanoes#Kilauea #KilaueaErupts pic.twitter.com/thkWooBmAV— BigData Earth (@BigDataEarth) July 16, 2018
Aha. Bruce Omori put his best shot of “tiny island” on Instagram. I think this is from Friday evening, or at any rate it’s from before lava connected it to the shore:
…No word on turtle rescue operations. Poor turtles.
More lava boats today. Probably taken from the cinder pit. Not sure he should be here, but what an amazing view across the river at the end.
The USGS has mentioned lava boats the size of “apartment buildings” during this eruption, but it’s always so hard to get a sense of scale.
The next clip gives some idea, if you can keep reminding yourself that those things on the hill in the background are full-sized trees: