USGS/HVO Deputy Scientist-in-Charge Steve Brantley has been giving weekly 10-minute slideshows at Tuesday evening Pahoa Community Meetings. Here’s last Tuesday’s.
Transcript:
Good evening. Thank you for coming out tonight. I have just a short presentation to provide for you this evening, and I invite you to come back to the back of the room at the end of the meeting. I have copies of the report that we put out on Thursday of last week, so you’re welcome to take a copy. Please, one per household. And I’ll draw attention to— the centerpiece of that report is a map. And I have a copy of the map back there that we can talk about if you’d like.
So the activity this past week has not changed significantly, either at Fissure 8 or along the lava channel or at the summit. The summit keeps dropping during these episodic earthquakes, where parts of the crater floor drop 2-2 ½ meters, 7-8 feet at a time, and also overall slow subsidence.
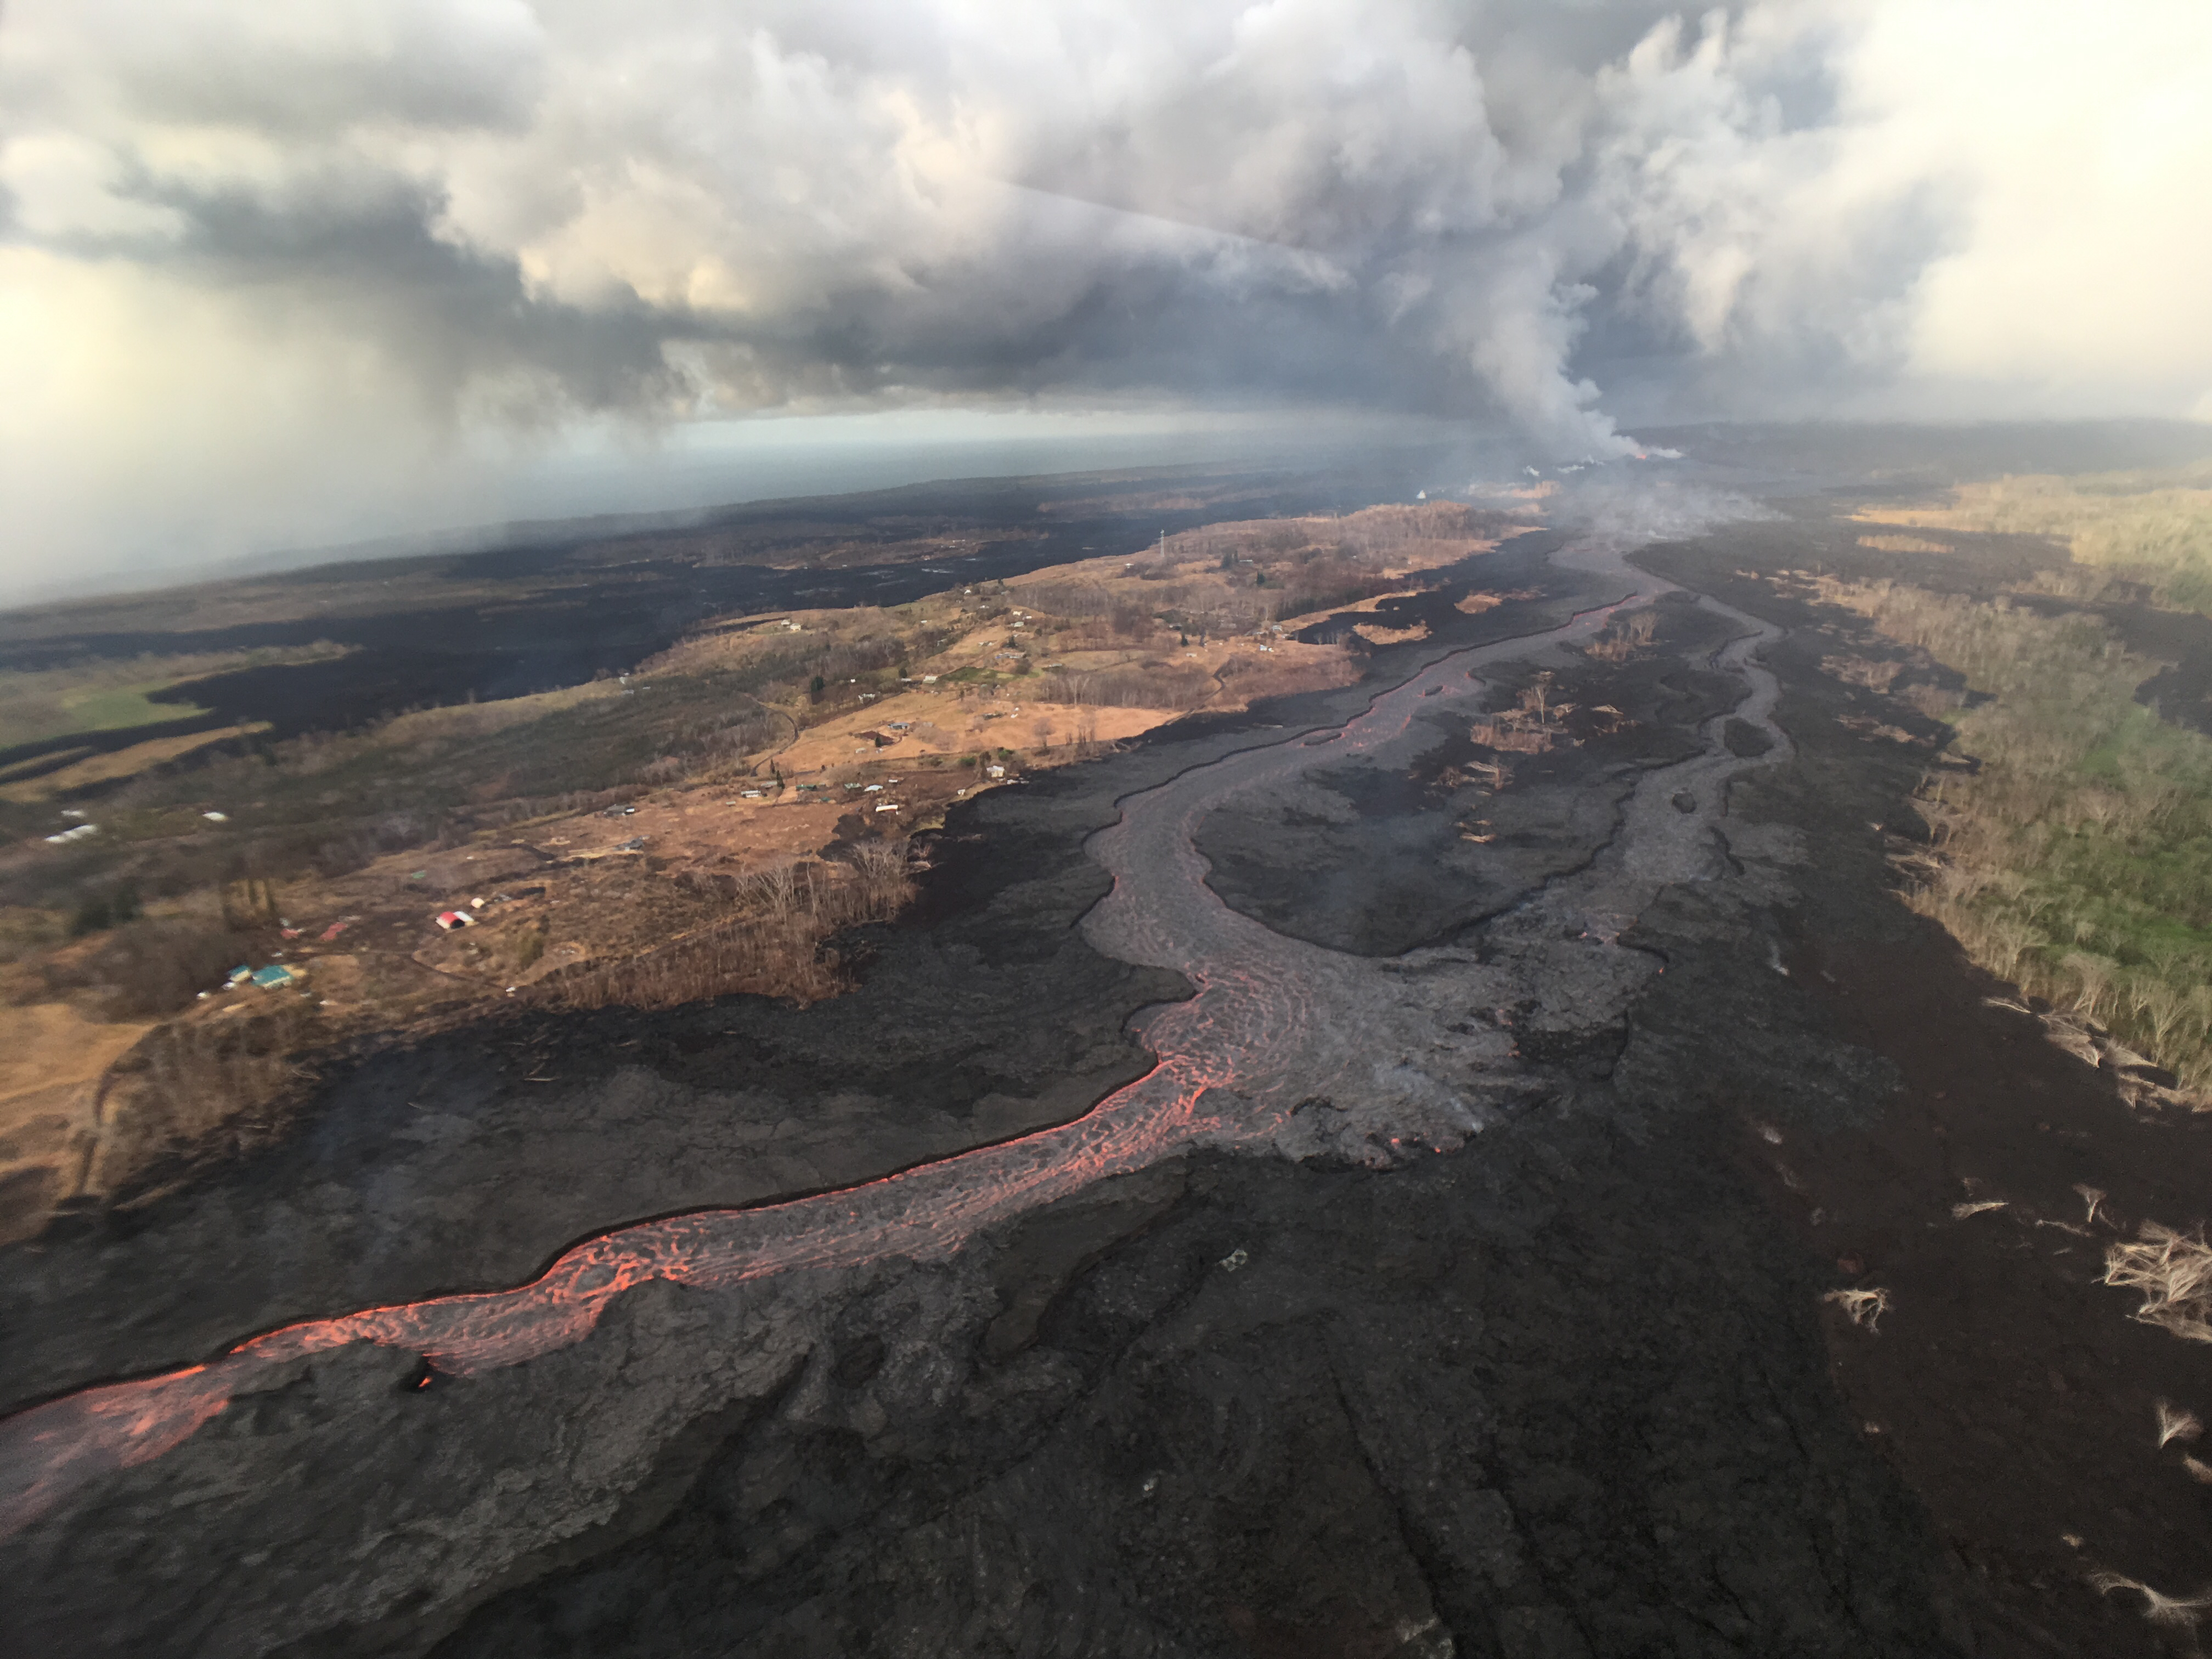
And at Fissure 8, the lava discharge is still very, very high. The upper part of the lava channel that we’re seeing right now has not changed. There have been a few little overflows here and there but nothing significant. In this photograph, the overflows you can see are the lighter gray areas right there.

If we turn around 180° and look further down-channel, about 2 miles further down the channel, looking toward the ocean…
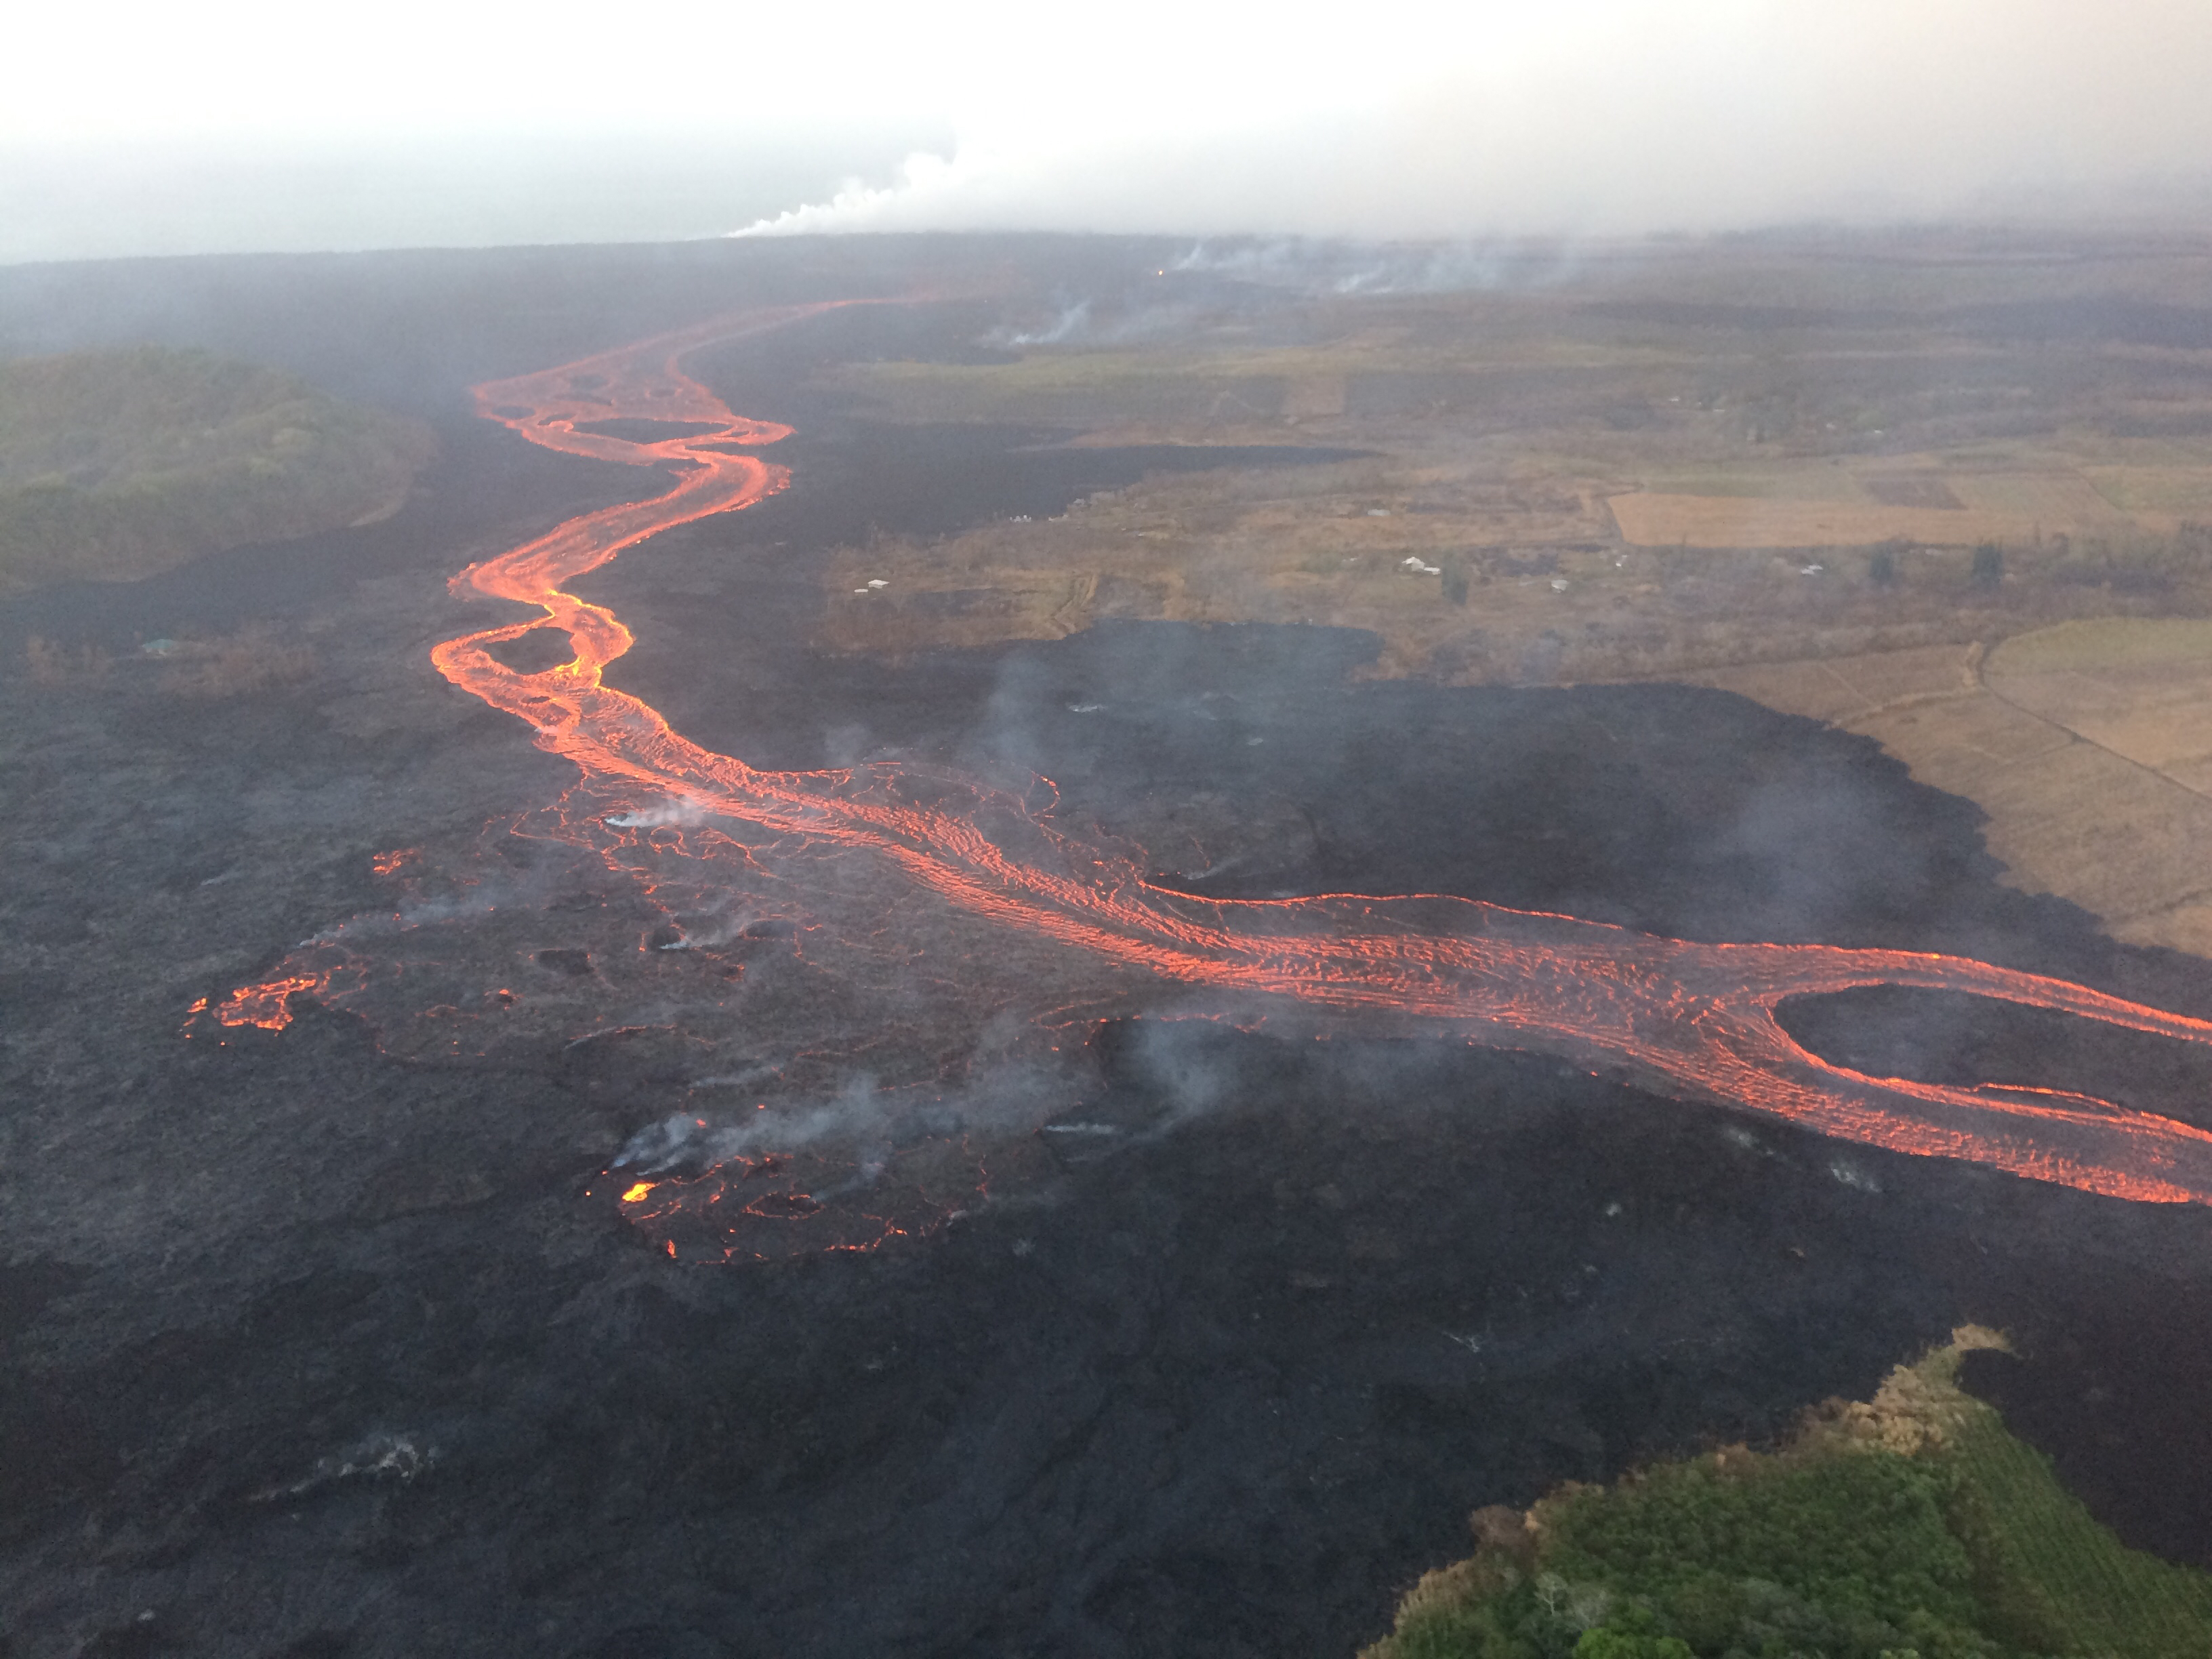
This is Kapoho Crater (far left). And so this is where the lava channel makes that right-hand turn to the south, and right at that section is where lava tends to pond. [Laser pointer circles area between two faint wisps of steam streaming from right to left across channel.] And so it is perhaps a susceptible are for the lava channel breaking out in different ways as it did a couple weeks ago.

[HCFD overflight of same area July 23. Use “island” in divided channel at far right and base of Kapoho Cater at upper left to orient this photo with previous.]
The lava channel is spilling into the ocean. There is an open channel all the way. And that is in these maps that we’ve been posting, it’s the [white] dashed line that runs into the ocean right about there.

You’ll notice on this map that red line, that dark red along the southern boundary of the flow— I should say, the western boundary. And that’s the addition of lava, the extension of the flow, just in the past day or two. And so just like the area to the north of the flow, where the a’a was basically dribbling out the margins and covering additional houses and land, that process is occurring here as well. So the channel is well inland of that edge, but the flow is still expanding. And as of this afternoon it looked like the flow boundary was about 500 feet or so from the Isaac Hale Park.
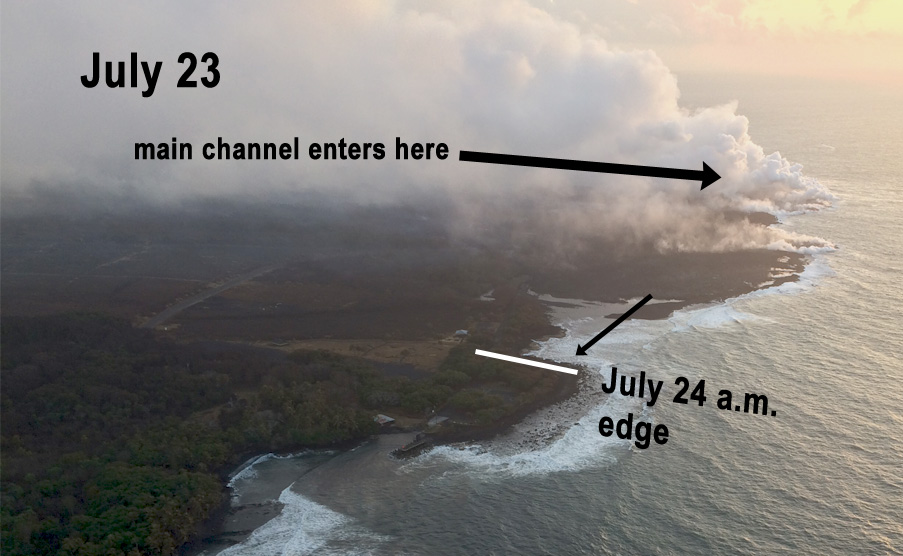
So here’s a photograph to illustrate that— a photograph from yesterday. (The ones taken today we couldn’t see the area because of the laze plume). So the main channel is entering the ocean just a little bit further back in this image, where the main plume is. And in the past day, the edge of the flow has extended that far. And so this morning, where that white line is marked the edge of the flow boundary. So it’s still about 600 feet from the boat ramp within Isaac Hale Park.

So this is a map that’s included in the publication. It looks very complicated. But it’s pretty straightforward. I’ll just run you through an example of how to use this map.
Each of these colors represent a “lavashed,” a portion of a “lavashed” as a flow might move toward the ocean. Here’s Fissure 8. [beginning of red line under “A”] This is the main channel [red line(s)] going off to the northeast; it loops around [by] Kapoho Crater, then enters the ocean.
So what we did is to break down that lava channel into 3 segments: A to B, B to C, and then past C. And then, if there were to be a breakout of the lava channel, or a complete diversion from that channel along that segment, where would the lava go?
For those of you who have been talking to us at the end of the sessions and the maps, we’ve been talking about this for the past several weeks: where’s the lava likely to go if it breaks out right here?
And “lavasheds” is just a way of showing you in a little different way where the flows could go.
So if the lava channel breaks down, or the cone breaks down between A and B, the first area to be inundated is the lavashed 1. We just labelled it 1. It’s kind of this tan-colored segment.
If the lava keeps going, it’ll move into lavashed 2, downslope. And this is exactly where the steepest— paths of steepest descent take us. It’s just that the lavashed is representing a broader area. So anywhere in that area that you drop water or drop lava, it’s going to flow toward the steepest descent line, the light blue line that you see there.
[The Lower East Rift Zone maps like this one, which have been posted every time lava covers new areas, indicate paths of steepest descent with blue lines. But lava flows are broader than those lines. So these “lavasheds” show the most likely area of the flow that would follow a particular line.]
If the lava continues to flow through lavashed 2, it’s likely to go into lavashed 3, and then enter the ocean up at the top of the map. If, however, there is a stall in lavashed 2, and the lava doesn’t keep going— maybe there’s another breakout that occurs so that there are multiple flows in lavashed 2, it’ll fill in that low area, and likely start spilling toward lavashed 4, which of course is right in the heart of Nanawale. And likewise, if then it keeps going, it’ll enter the ocean just to the east of the red area up there, lavashed #3.
So it’s a way to anticipate where flows might go first and second and third, depending on where lava spills out of the channel.
Likewise if there’s a breakout in the lower part between points B and C, lavashed #5 would be where the lava would flow, and/or lavashed 6, depending on where the breakout occurs.
Ok, in the report, there’s a number of bullets that I can repeat, and you’ve heard them all before, except for maybe one.
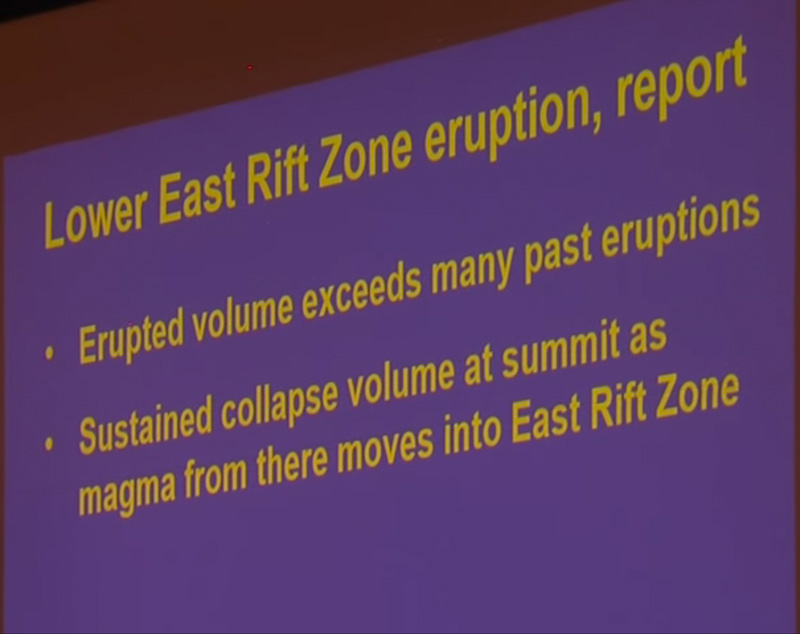
So the erupted volume of this particular eruption has exceeded the eruptive volume of the historical events of the past 200 years.
The sustained collapse at the summit means that the magma reservoir up there is supplying a steady supply of lava to the Lower East Rift Zone. So there’s abundant availability of magma up at the summit.
And there’s very little deformation occurring, or very little earthquake activity occurring in the Lower East Rift Zone. And that’s telling us that there’s a nice open pathway from the East Rift Zone up to the surface at Fissure 8.
With time, the likelihood that other fissures will erupt along the segment seem to be decreasing in time. At least that’s our view. Fissure 8 seems to be wide open and has a steady pathway to the surface.
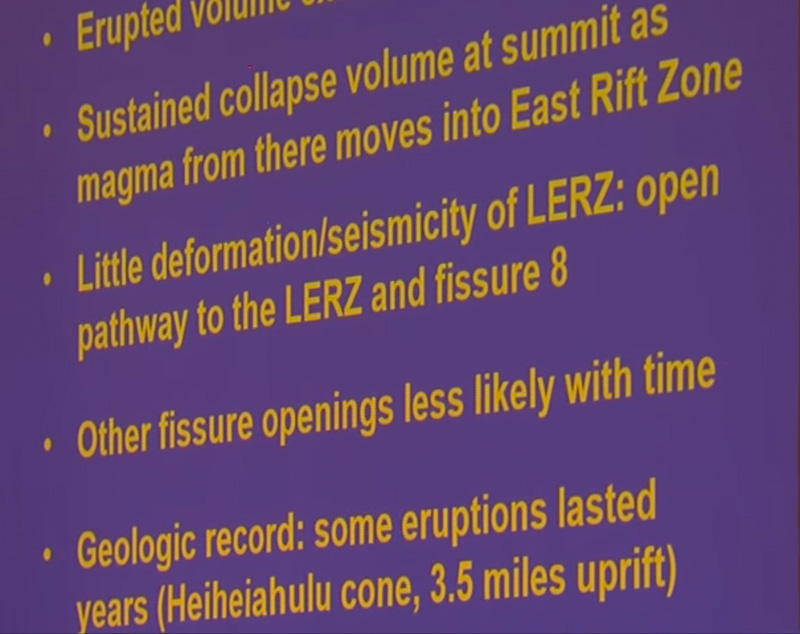
The geologic record suggests that some of the larger eruptions of the Lower East Rift Zone have lasted for years. Some number of years, not sure— we weren’t here 2-400 years ago. The Hawaiians don’t have enough detail in their stories to pin down exact timeframes, as I understand it.
The most readily— the best example is Heiheiahulu cone, which is a very broad, quite large shield cone that’s just about 3 miles up above Highway 11. If that kind of activity ends up happening here, we could expect the eruption to last for years.
[Final bullet point on slide: “Eruption man continue for months to years.”]
So in conclusion we’re suggesting that it looks like this eruption could occur for months to years, because of all these conditions that we described above.
So up at the summit, activity hasn’t changed. The most recent collapse event was earlier this morning. They seem to be occurring about 30-40 hours timeframe.
So I’m going to show you a photograph to try to represent the scale of how much the summit is dropping.

At that little circle, you can see a little offset that looks like a little cliff there in the shaded relief map. So we’ll show you a photograph taken from here [cliff/bluffs due north and a titch to the east] looking across to that area, right here.

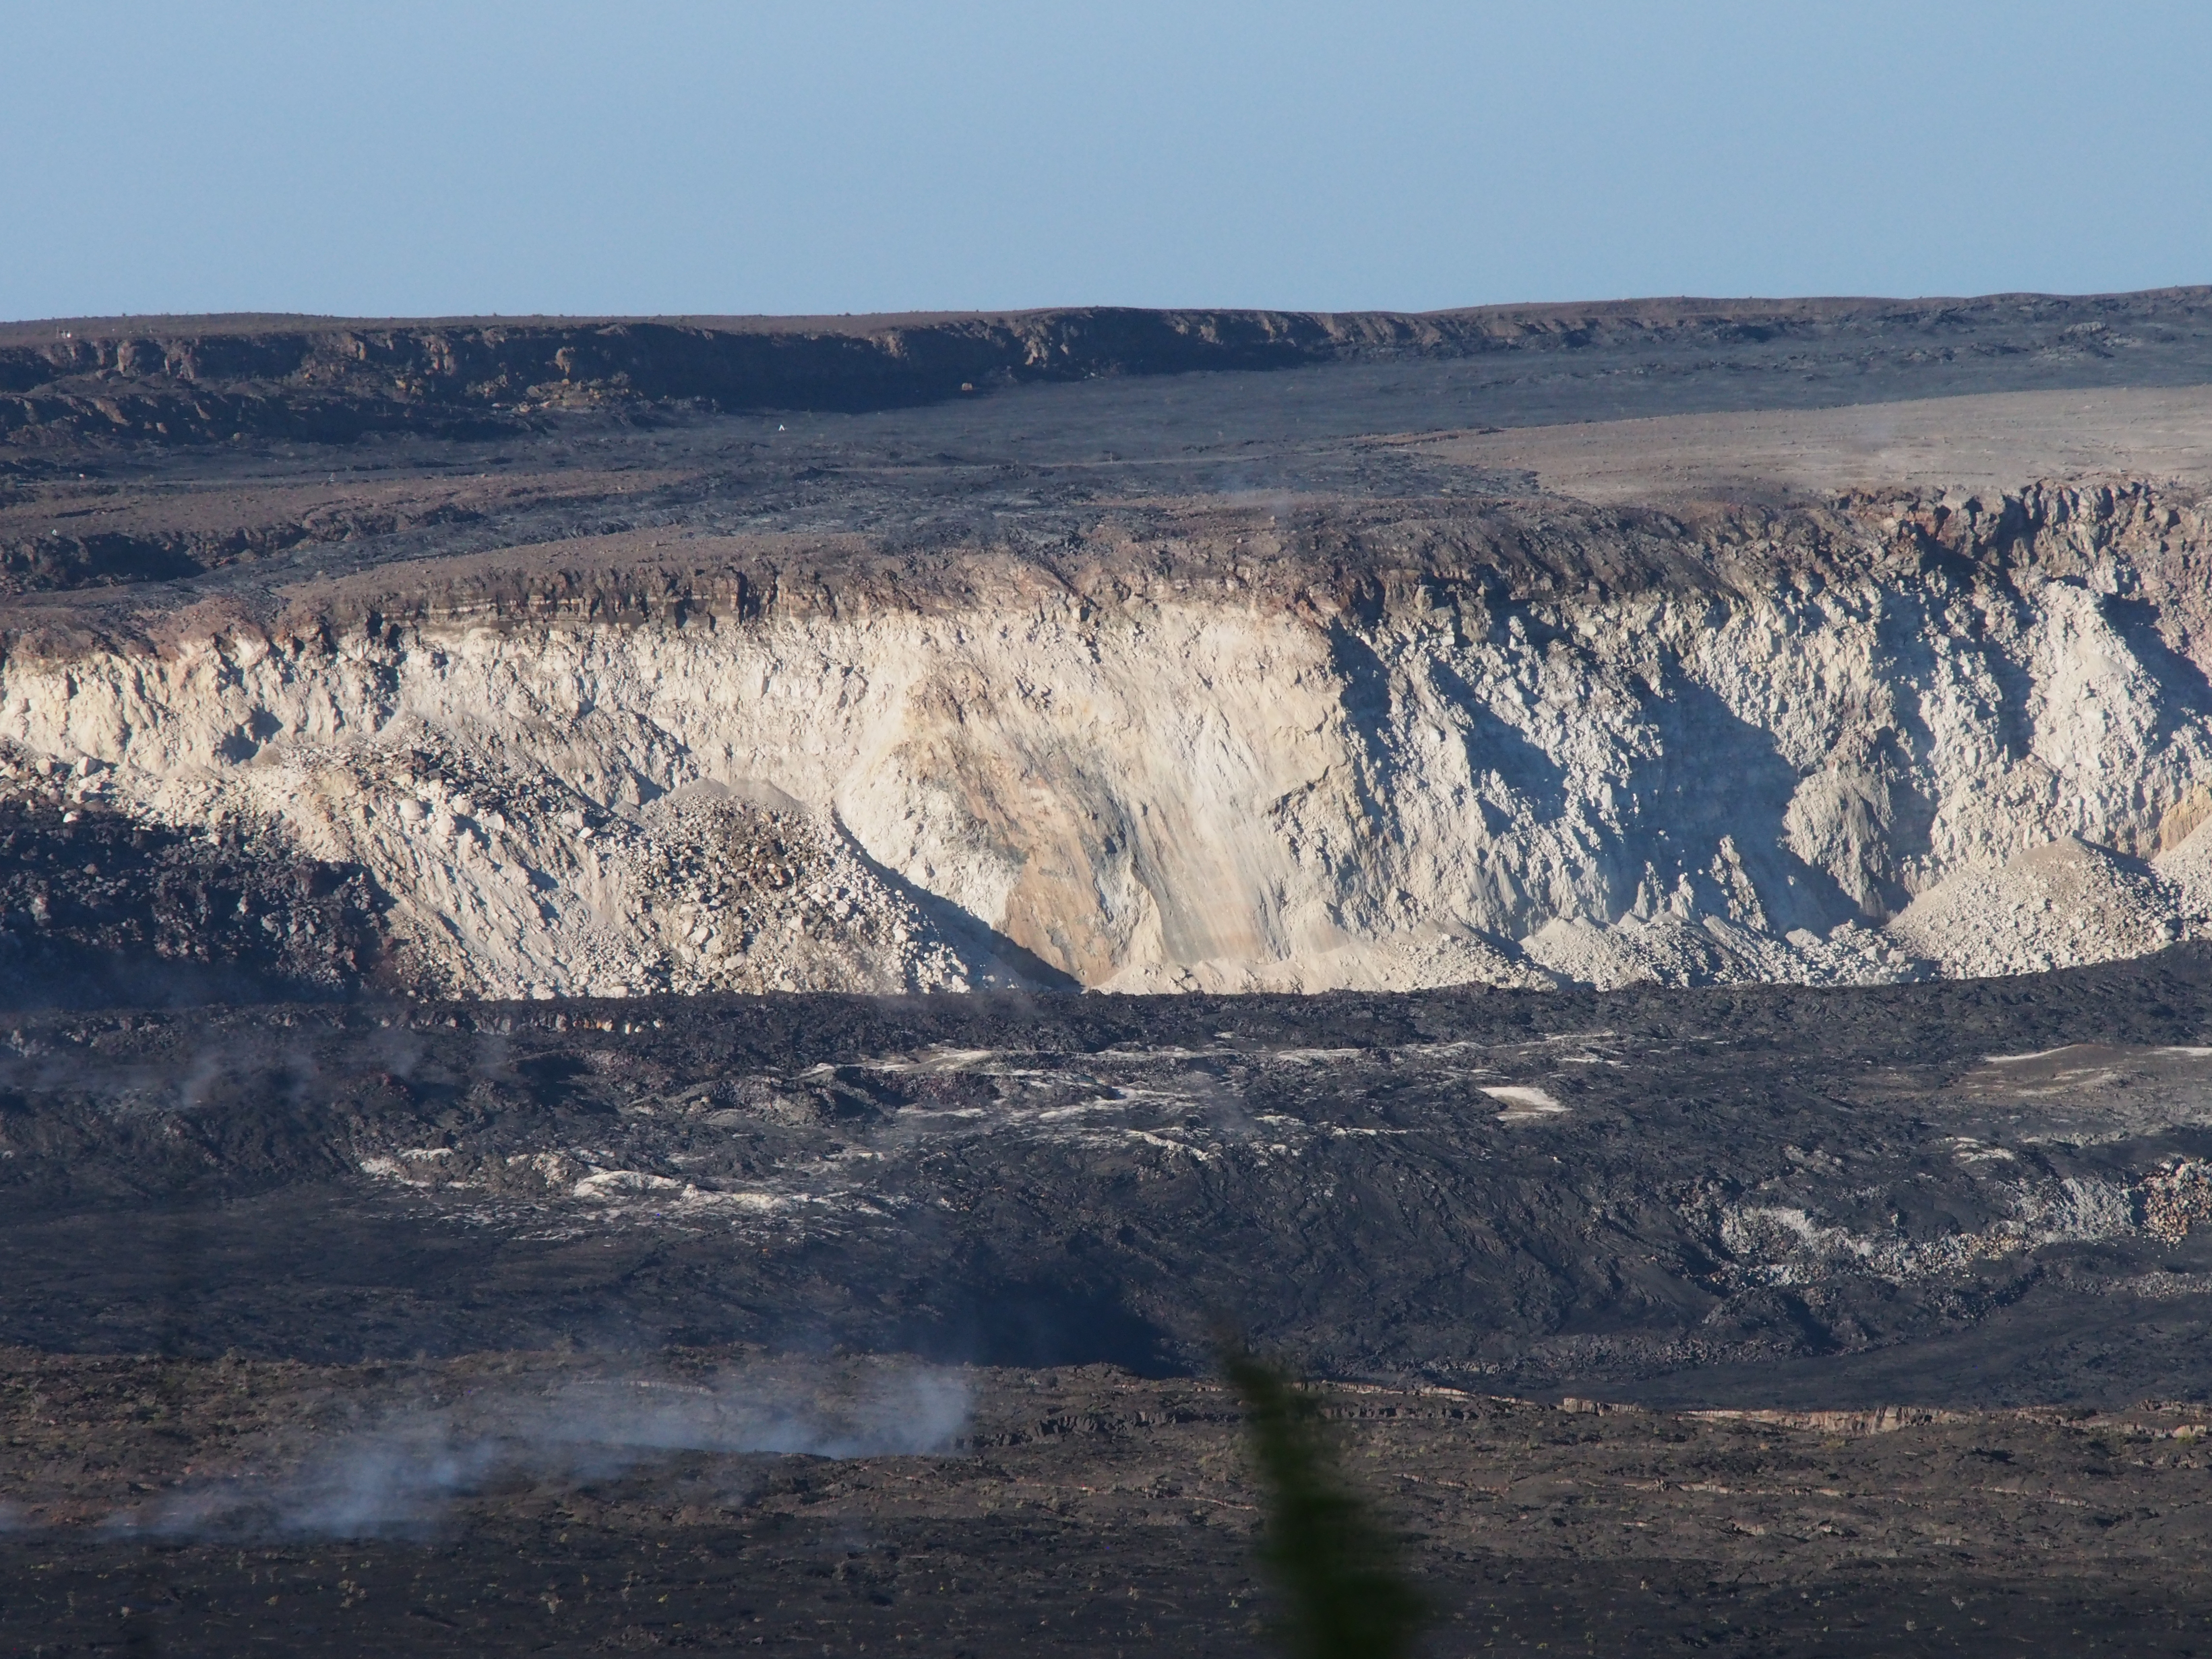
[Steve Brantley has added a vertical scale bar against the cliff labelled “215 feet”]
And that scarp face is all brand new. It’s all formed in the past 6 weeks as the crater floor here in the foreground drops during each of these collapse events, about 2 to 2½ meters at a time.
So there have been almost 60 of these collapse events since the activity started in mid-May.
So, magma’s still draining from the summit reservoir, moving into the East Rift Zone, and Fissure 8 is still erupting as much as it ever has.
Please come back and grab a copy of the report if you’d like, and we can talk about the map as well. Thank you.